Introduction
This article explains how to configure the Ceph (REST) adapter to monitor Red Hat Ceph storage systems using the REST API protocol.
Prerequisites
Before configuring the policy:
-
Read these articles to make sure the prerequisites are met:
-
Run the ceph mgr services command on the Ceph system to determine the protocol/port that has been configured. In the example below, it’s https/8443:
[root@ceph-storage2 ~]# ceph mgr services { “dashboard”: “https://ceph-storage2.internal.sentrysoftware.net:8443/” }
For optimal performance, we recommend reserving 2 CPU cores and at least 4 GB of RAM for operating the Storage Analyzer KM. The amount of memory allocated to the Java engine of the KM may be adjusted via the /SENTRY/STORAGE/collectionHubHeapSizeMax configuration variable. For more details, refer to:
Procedure
-
Log in to BMC TrueSight/Helix Operations Management
-
Create a new monitoring policy:
- Specify the general properties and agent selection criteria
- Add a monitoring configuration
- Select the Storage Analyzer solution
- In the Storage Configuration section, click Add to create a new Endpoint

-
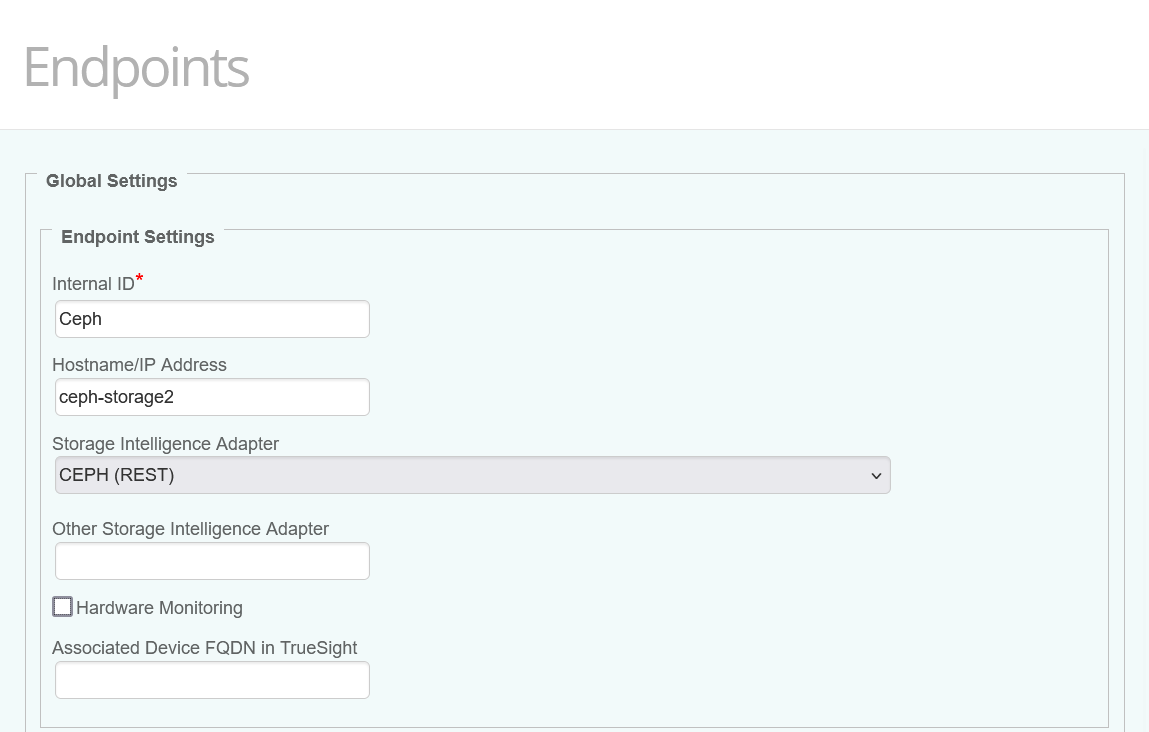
Configure the Endpoint Settings:
- Enter an Internal ID
- Specify the Hostname/IP address of the Ceph storage system
- Select CEPH (REST) from the Storage Intelligence Adapter dropdown list
- Untick the Hardware Monitoring checkbox
- (Optional) Specify a custom device name in the Associate Device FQDN in TrueSight field. For more details, refer to More Easily Identify Your Devices Monitored Through a Proxy in TrueSight / Helix Operations Management.

-
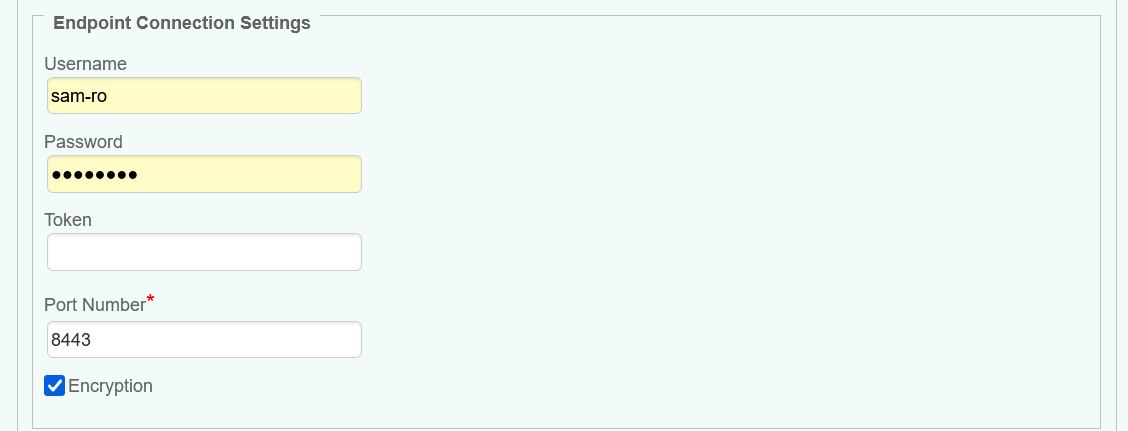
Configure the Endpoint Connection Settings:
- Provide the Username and Password
- Specify the port (7000 or 8443 by default). See the output of ceph mgr services above
- Check Encryption if using the HTTPS protocol. See the output of ceph mgr services above

-
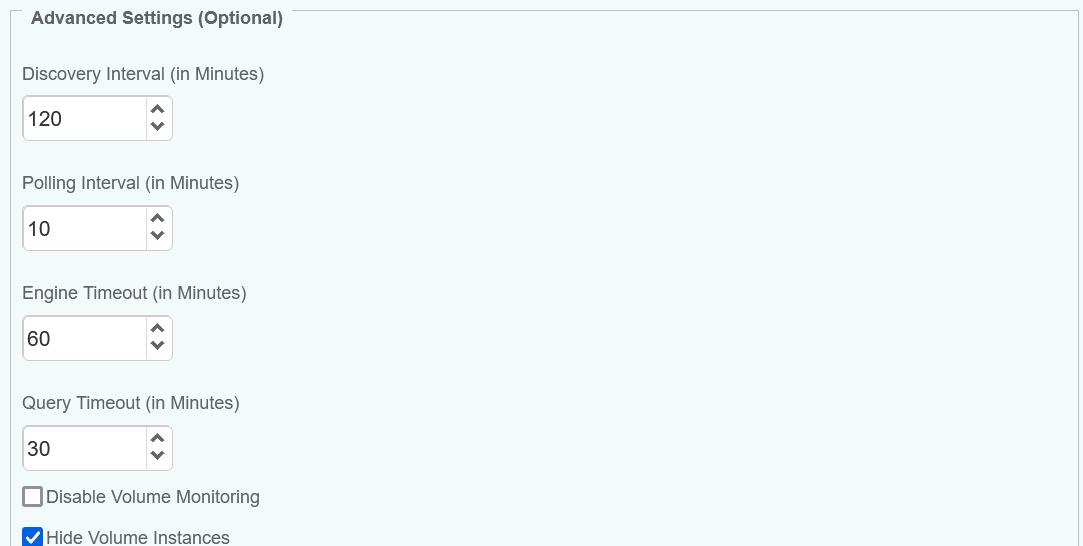
Configure the Advanced Settings:
- In large environments, we recommend increasing the values of the Discovery Interval and Polling Intervals to maintain the workload of the PATROL Agent and monitored systems at a reasonable level.
- Since volume monitoring is highly resource-intensive, we recommend disabling it if not needed to reduce the workload on the KM and the PATROL Agent.
- Because displaying thousands of volumes will have a huge impact on the PATROL Agent and on BMC TrueSight/Helix, volumes are discovered but NOT displayed. Uncheck the Hide Volume Instances box if required.

-
Save the policy and verify that it applies to the right PATROL Agent.
-
Allow the KM some time to discover your storage system(s). Access the Devices page and search for their hostname, IP address, FQDN, or custom MetaFQDN/Device Name. You can also refer to the article Identifying and Locating Devices in TrueSight to learn how to run the below PSL script in the Query PATROL Agent window:
    CLASS_NAME = "SKM_SYSTEM";
    nodes = get_vars("/".CLASS_NAME, "subnodes");
    foreach node (nodes)
    {
    objectPath = "/".CLASS_NAME."/".node;
    instanceName = get(objectPath."/MetaFQDN");
    output  = [output, "Device Name:  ".instanceName ];
    }
    print(output);
Related Topics
- How to Monitor Dell EMC Unity Storage Systems with Storage Analyzer KM
- How to Monitor Hitachi E and G Series Storage Systems with Storage Analyzer KM
- How to Monitor Pure Storage Systems with Storage Analyzer KM
- How to Monitor Dell EMC ScaleIO/PowerFlex Storage Systems with Storage Analyzer KM
- How to Monitor NetApp Storage Systems via NetApp Active IQ Unified Manager with Storage Analyzer KM
