Monitoring Using IPMI
In this article, we will explain the basics of how IPMI can be used to monitor hardware, its advantages and disadvantages and when it should be used.
Hardware Sentry KM does have a very advanced way to leverage the IPMI protocol, but in general it should only be used as a last resort as other methods provide better monitoring and better information about monitored components.
About IPMI
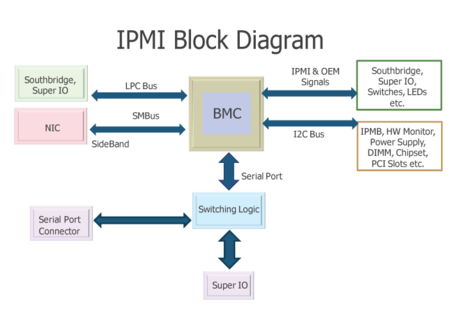
IPMI is an industry-wide standard method of communicating directly with the motherboard of a computer system. It can be accessed out-of-band (through a server’s management card) or in-band using drivers installed as part of the operating system to communicate with the system’s BMC Baseboard Management Chip).
Various clients exist to query the BMC chip using the IPMI protocol, such as ipmitool, ipmiutil, freeipmi and openipmi. For examples in this article we will be using ipmitool.
Using IPMI for Hardware Monitoring
IPMI can be used to query the motherboard to find out the status of various hardware components in a server, as well the current values of various sensors (temperature, voltage, fan speeds, etc.).
There are three main types of information that IPMI can collect:
- FRU information,
- numeric sensors,
- and discrete sensors.
The amount of information available from standard IPMI varies considerably from manufacturer to manufacturer (with HP and IBM being notably poor, and Dell and Oracle being OK). Older systems generally also have less information available
than newer ones.
Systems that Can Be Monitored
Generally only servers support IPMI. The chassis of blade systems, switches, storage systems, etc., do not support this protocol and require alternative monitoring solutions.
Components that Cannot Be Monitored
IPMI queries are sent to the server’s BMC chip. The BMC chip can only provide information about components it is in direct communication with,generally components physically on the motherboard. Components in PCIE slots, or any independent chips on the motherboard (network cards, RAID cards, HBAs, etc.) do not provide sensor information to the BMC chip and thus cannot be monitored via IPMI.
FRU Information
FRUs (Field replaceable units) are parts of a system that can be easily replaced (or for this purpose the entire system itself). The server’s BMC chip will often be able to collect some basic information about components of the system that
can be replaced. For example a power supply’s manufacturer, model, part and serial numbers. This is called FRU information. By running the command ipmitool fru, the BMC chip will return basic information about components it can communicate with.
Example:
    FRU Device Description: Power Supply 1 (ID 1)

    Board Mfg Date : Mon Jan 1 00:00:00 1996

    Board Mfg : EMER

    Board Product : IBM Designed Device

    Board Serial : K11219531CF

    Board Part Number : 39Y7200

    Board Extra : 39Y7201

    Board Extra : 3300

    Board Extra : 00

    Board Extra : 8000

    Board Extra : 0
Depending on the manufacturer, this FRU information can be virtually non-existent, or it can be as detailed as to include the systems, its power supplies, memory, processors and any storage directly attached to the motherboard.
Numeric Sensors
There are various commands to collect a list of sensors inside a server using ipmitool, but here we will use the ipmitool sdr elist all format.
IPMI numeric sensors (temperatures, voltages, fan speeds, etc.) are relatively easy to understand. Generally you are provided with a sensor name/type and the component it is attached to (Sensor ID/type and Entity ID), along with its current value (Sensor Reading).
The system can also provide various upper and lower thresholds for this sensor to indicate the acceptable ranges for this sensor. (These are often, but not always present).
The status and states values for numeric sensors should generally be ignored as they almost always indicate “ok” irrelevant of the actual state of the server.
    Sensor ID : PS 1 Temp (0x32)

    Entity ID : 10.1 (Power Supply)

    Sensor Type (Analog) : Temperature

    Sensor Reading : 20 (+/- 0) degrees C

    Status : ok

    Nominal Reading : 21.000

    Upper non-recoverable : 45.000

    Upper critical : 41.000

    Upper non-critical : 38.000

    Positive Hysteresis : 4.000

    Event Message Control : Per-threshold

    Readable Thresholds : unc ucr unr

    Settable Thresholds :

    Threshold Read Mask : unc ucr unr

    Assertion Events :

    Assertions Enabled : unc+ ucr+ unr+

    Deassertions Enabled : unc+ ucr+ unr+
Discrete Sensors
Discrete IPMI sensors are what make hardware monitoring via IPMI particularly difficult.
If we have a look at a discrete sensor from a power supply:
    Sensor ID : Power Supply 1 (0x70)

    Entity ID : 10.1 (Power Supply)

    Sensor Type (Discrete): Power Supply

    States Asserted : Power Supply

    [Presence detected]

    Assertion Events : Power Supply

    [Presence detected]

    Assertions Enabled : Power Supply

    [Presence detected]

    [Failure detected]

    [Power Supply AC lost]

    Deassertions Enabled : Power Supply

    [Presence detected]

    [Failure detected]

    [Power Supply AC lost]
We can see similar information to numeric sensors (Sensor ID and Entity ID), but after that we get into a more complex game of what the sensor is asserting and what its possible states are.
The States Asserted shows a list of states that the sensor is currently in, so for example the above sensor is saying that its Presence (is) detected. Later in the output we can see other states that the sensor could assert (i.e. say is happening), but currently is not, like Failure detected and Power Supply AC lost.
The main difficulty here is that there is no defined list of states that can be asserted, and it is not clear whether an asserted state is good or bad. (Presence Detected is usually good, Failure Detected is not).
Discrete sensors can however be even less helpful. Take the following example:
    Sensor ID : PWRBS (0x50)

    Entity ID : 23.0 (System Chassis)

    Sensor Type (Discrete): Power Supply

    Sensor Reading : 0h

    Event Message Control : Per-threshold

    States Asserted : Digital State

    [State Deasserted]

    Assertions Enabled : Digital State

    [State Deasserted]
Here we see another power supply sensor called PWRBS. This sensor does not have a list of states, the whole sensor can only be in an asserted or deasserted state. The problem is that you never know if asserted is a good thing or not. Take the following list of sensors:
    HDD4/OK

    SP_OK

    HDD4/SERVICE

    TEMP_FAULT
For the first two, an asserted state would be considered OK, where as for the last two, it would be considered a failed component.
There is no defined list of sensors, every manufacturer and generation of systems has its own sensor list that needs to be evaluated to understand when asserted is good or bad, and any custom States Asserted that might be listed.
Useless Sensors
Many sensors in a system do not actually assert any state or provide a numeric sensor value. These sensors thus provide no useful information in terms of the state of the system’s hardware. For example:
    Sensor ID : One of The CPUs (0x94)

    Entity ID : 37.4 (Group)

    Sensor Type (Discrete): Processor

    Assertions Enabled : Processor

    [Disabled]

    Deassertions Enabled : Processor

    [Disabled]
Just because a component’s sensor is listed, does not mean we can monitor that component.
Sensor Grouping
Each component (entity) can have zero to many useful sensors attached to it. To get a proper view of the system, each entity’s sensors should be grouped together and a “worse case” taken. For example a hard drive might have a /SERVICE and an OK2RM (OK to remove) sensor attached to it. Having both of these sensors alerting only indicates a single fault in the system, not two.
The FRU information is also separate from the sensor information, thus to know what type / size / model of hard drive needs replacing, you need to match sensor’s entities to the FRU information.
Alternatives to IPMI Monitoring
Generally IPMI monitoring should only be used when no viable alternative exists.
As well as supporting IPMI, Hardware Sentry KM provides many different monitoring methods (often more than one per manufacturer) that can be used to monitor your server. These methods should be used in preference to IPMI.
Out-of-Band Monitoring
Most recent servers have built in management cards that can provide the status of hardware components inside that server. These management cards can be queried using SNMP, SSH, REST, etc. (see individual manufacturers connectors pages for more information).
Generally, the more recent the server, the better the information available from the management card is. Older systems might not provide full FRU information, or provide the status of sub-systems like Network and RAID cards.
This is generally the easiest method to monitor a server as it does not require any software to be installed or access to the server’s operating system.
In-Band Monitoring via a Manufacturer’s Agent
If a manufacturer has an agent designed to run on its servers, this is generally the monitoring method that provides the highest quality monitoring. HP’s Insight Manager, Dell’s OpenView, etc. agents are able to combine all information available via IPMI, component drivers, and their own internal databases (list of sensors and meanings, supplemental FRU information), to provide both the full status of all components, but also their FRU information where available.
Generally, we would recommend to install the most recent version of the manufacturer’s agent that is available for your operating system. Agents generally support as many older systems as possible. The agent should however always be more recent that the server. Installing old agents on new systems rarely works and almost always results in some sensors or FRU information not being collected.
Monitoring via ESX’s CIM Agent
ESX provides hardware information via its WBEM (CIM) API. The information here will be generally the same as what can be found under the hardware tab of vSphere / vCenter.
Hardware Sentry can collect hardware status from this API as well as a full hardware inventory.
Some manufacturers (HP / Dell) also provide a customized version of ESX (with a separate sub-agent, that can also be manually installed on standard version of ESX) that act like full in-band manufacturer’s agents. Hardware Sentry KM also includes connectors to leverage these sub-agents instead of the native ESX agents and these should be used where possible as they provide better hardware monitoring and inventories.
Related Topics
- Hardware Monitoring: Monitoring Linux Servers in TrueSight
- TrueSight Presentation Server Does Not Load After Installing Hardware Sentry TSPS component
- EMC VNXe - File System Running Out of Space
- Forcing Detection of WMI-based Connectors when Required WMI Namespace is Unavailable
- Performance and Stability Best Practices for Hardware Sentry KM