Introduction
By default, PATROL events are not generated when thresholds are breached if Sentry Software’s KMs have been configured through CMA. To be able to use the Sentry Software KMs’ macro variables and events, you will have to set agent thresholds.
To illustrate how to set agent thresholds, the following use case will be described in this article:
- We will configure Monitoring Studio to run the command
cat /usr/local/monitor/servicestatus.logto obtain the status of theSNMPD_SVCservice. - Then, we will extract the numeric value contained in the 3rd column of the log file, which uses pipes (|) as column separator:
  HTTPD_SVC|NORMAL|0|OK
  SNMPD_SVC|ALARM|2|BAD
- Finally, we will set an Agent Threshold on the instance of this Numeric Value Extraction to have the following event to be triggered when SNMP is down:

Procedure
To configure an Agent Threshold on a specific instance:
- Create a monitoring policy for Monitoring Studio
- Configure a Monitor Group:
-
In the Add Configuration Panel, click Add to open the Monitor Groups panel
-
Specify the Host Settings:
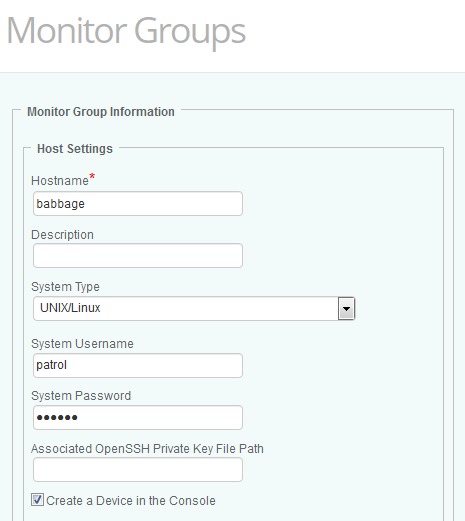
- Hostname: Enter the name (or IP address or Fully Qualified Domain Name) of the host on which the technology you wish to monitor is running
- System Type: Select the type of the operating system that is running on the host that will be monitored (Windows, UNIX/Linux, or Other). Select Other for any host that will not behave as a regular Linux or UNIX system would.
- System Username: Enter the username that will be used by Monitors relying on System Credentials to collect data from the targeted host.
- System Password: Enter the password for the username provided above, that will be used by Monitors relying on System Credentials to collect data from the targeted host.
- Create a Device in the Console: Select this option if you wish Monitoring Studio to create an instance of the device in TrueSight Operations Management. All associated Monitors and their events and attributes will be attached to this new device in TrueSight Operations Management. If this option is not selected, they will be attached to the device matching the PATROL Agent host.
- Configure the Command Lines monitor:
-
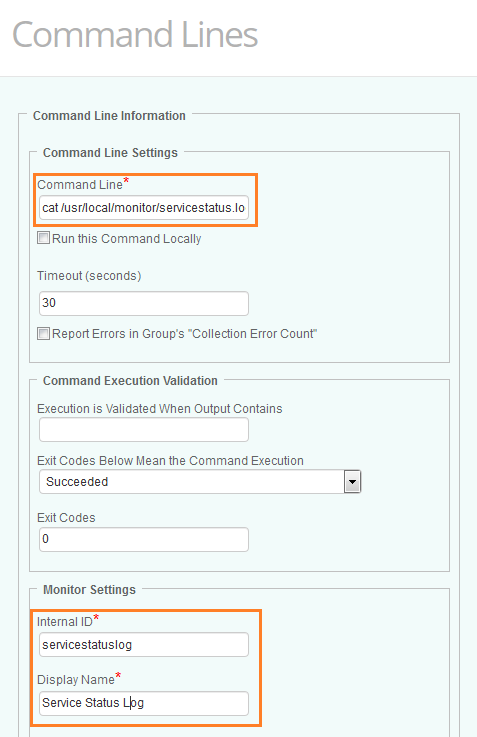
Scroll down to the Command Lines section and click Add to configure the command line to execute
-
In the Command Line Settings field, enter
cat /usr/local/monitor/servicestatus.log -
Enter the Monitor Settings Internal ID and Display Name (in our example servicestatuslog and Service Status Log)
-
Click OK.
- Configure the Numeric Extractions monitor:
-
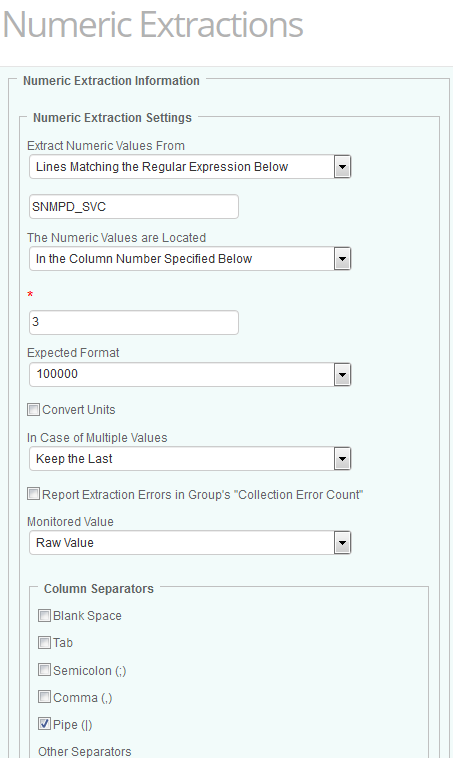
Scroll down to the Numeric Extractions section and click Add
-
From the Extract Numeric Values From list, select Lines Matching the Regular Expression Below and enter the name of the service. In our example, SNMPD_SVC
-
From the Numeric Values are Located list, select In the Column Number Specified Below and enter 3
-
From the Expected Format list, select 100000
-
Select Pipe (|) as the column separator.
- Configure Alert Actions for the Numeric Value Extraction:
-
Scroll down to the Monitor Settings section
-
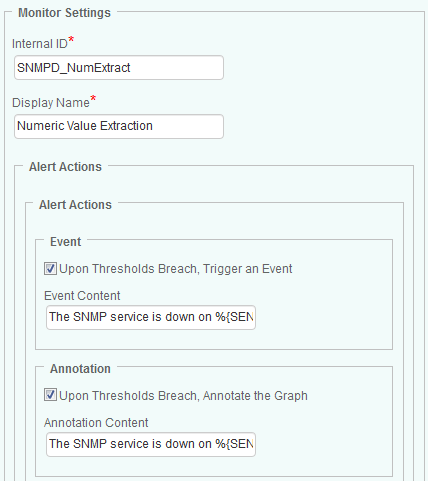
In the Internal ID field, enter SNMPD_NumExtract
-
In the Display Name field, enter Numeric Value Extraction
-
Check the Upon Thresholds Breach, Trigger an Event and Upon Thresholds Breach, Annotate the Graph boxes and indicate the Event and Annotation context (in our example: The SNMP service is down on %{SEN_HOST_NAME})
-
Click OK for all opened panels
-
Click the Agent Threshold tab and click Add Agent Threshold
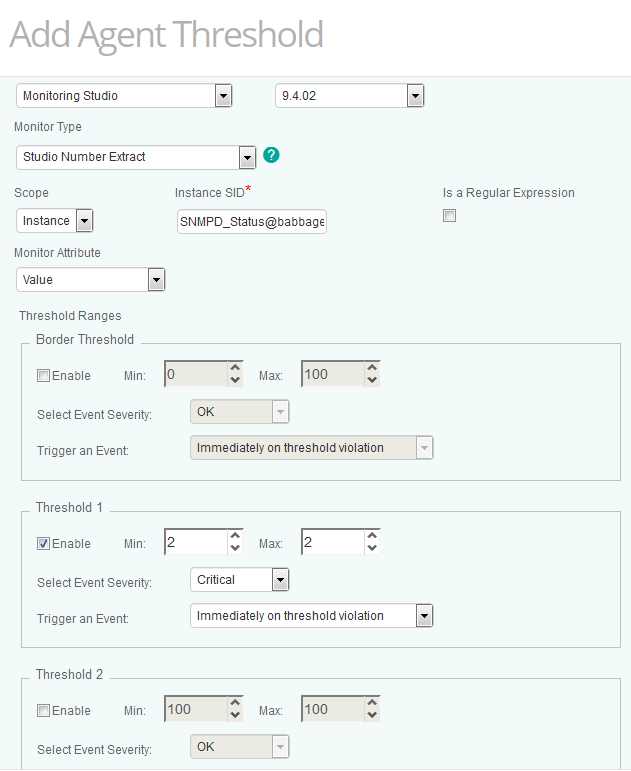
- From the Monitoring Solution list, select Monitoring Studio
- Select the relevant version
- From the Monitor Type list, select Studio Number Extract
- From the Scope list, select Instance and enter the Instance SID. The Instance SID can be found in the TrueSight Infrastructure Management console by placing the cursor on the required instance:

- In the Threshold 1 section, check the Enable box and enter 2 in the Min and Max fields
- From the Select Event Severity list, select Critical
- From the Trigger an Event, select Immediately on threshold violation
- Click OK
- Click Save.
To verify that the agent thresholds have been correctly applied, run the following PSL statement through the “Query PATROL Agent” menu:
print(get_ranges("/SEN_MS_NUMBER/<Group ID>@<Host ID>:CommandLine:<Command-line ID>:Number:<Numeric value Extraction ID>/Value")."\n");
where:
<Group ID>is the Internal ID as entered when configuring the Monitor Group Settings<Host ID>is the hostname<Command-line ID>is the Internal ID as entered when configuring the Internal ID of the Command Line Monitor<Numeric value Extraction ID>is the Internal ID as entered when configuring the Numeric Value Extraction Monitor
In our example: print(get_ranges("/SEN_MS_NUMBER/SNMPD_Status@babbage:CommandLine:servicestatuslog:Number:SNMPD_NumExtract/Value")."\n");
If agent thresholds are correctly applied, you should obtain the following result:
0 0 0 0 0 0
1 2 2 0 0 0
0 0 0 0 0 0
Related Topics
- Troubleshooting Missed Events
- How NetApp Filers KM for PATROL Reports 'Failed' and ‘Degraded' Status Values in the PATROL Console
- Too Many Hardware Sentry Internal Events Generated in TrueSight/PATROL Consoles
- How to Generate Test PATROL_EV Events Using Monitoring Studio X
- Handling PATROL Events Generated by Sentry KMs in BMC Helix Operations Management