Description
To integrate a BMC PATROL KM into BMC ProactiveNet Performance Management, you need to create a specific adapter. An adapter for BMC PATROL facilitates the pulling of performance data from existing BMC PATROL solutions into BMC ProactiveNet. Using an Adapter, you can import BMC PATROL application classes (provided in a Knowledge Module -KM) into BMC ProactiveNet. The Adapter periodically synchronizes the performance data collected by these application classes into BMC ProactiveNet.
Two methods exist to create an adapter for BMC PATROL:
The automated workflow (recommended)
This method enables the PATROL Agent to automatically connect to the Integration Service, register itself, and start sending performance data to the Integration Service. The PATROL Agent is added to the default profile called "_SA_DEFAULT_" in the Integration Service. The Integration Service uses the SAdapter (Staging Adapter) to accept inbound connections from the PATROL Agents. The SAdapter is a component of the Integration Service which is used for the PATROL Agent phone-home feature. This method requires PATROL Agent v3.8.50 or higher.
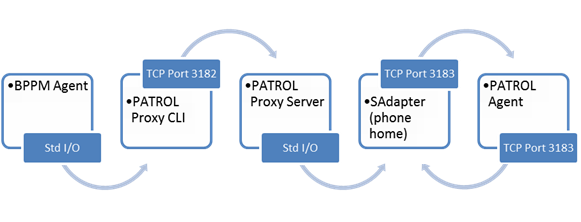
Figure 1 - Automated Workflow: The PATROL Agent connects to the Integration Service
The manual method
This method relies on the p3Adapter profile. Each p3adapter is responsible for querying a set of PATROL Agents in a single security domain and retrieves data. This method is not documented in this article.
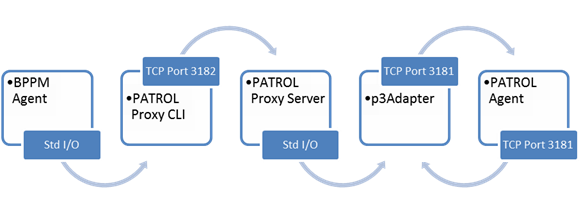
Figure 2 - Integration Service connects to PATROL Agent
You can also use the following methods to send events directly to the BPPM cell but you would lose the benefit of the BMC ProactiveNet analytic engine (rate process). The rate process creates the alarms when thresholds are breached and directly sends them to the BPPM cell.
| PATROL Architecture | Method to be Used |
| PATROL 7 | BMC Impact Integration for PATROL v7 |
| PATROL 3 | BMC Impact Integration for PATROL V3 (MCXP) |
| PATROL Agent 9.0 | Wpconfig (Events will be directly sent to cells) |
For more info about the above methods, please refer to the knowledge article: Integrating the Events Generated by the KMs into BMC Event Manager.
Procedure
Step 1: Creating an Adapter for BMC PATROL KM
To use the SAdapter “phone-home” feature:
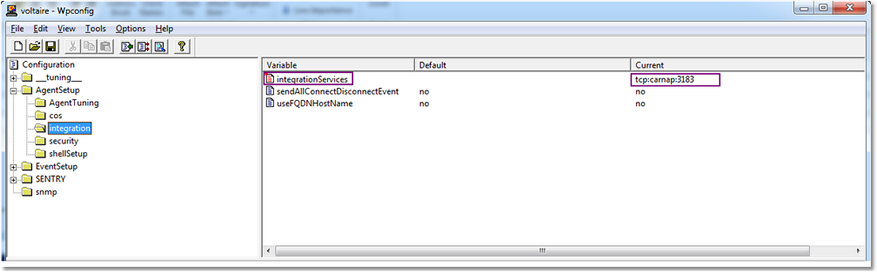
- In Wpconfig, make sure that the “integrationServices” variable is properly set for your PATROL Agents. It should point to the BPPM Remote Agent where the Integration Service is running (pproxsrv) using the following syntax: tcp:<BPPM_remote_agent>:3183.
Example:
PATROL_CONFIG
"/AgentSetup/integration/integrationServices" = { REPLACE = "tcp:carnap:3183" }
In this example, the PATROL Agent will send its performance data to the BPPM Integration Service called “carnap”
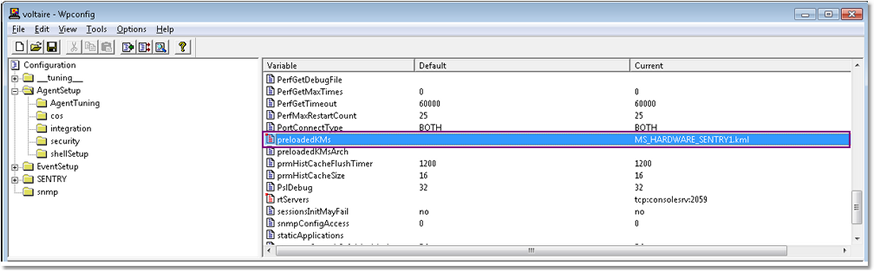
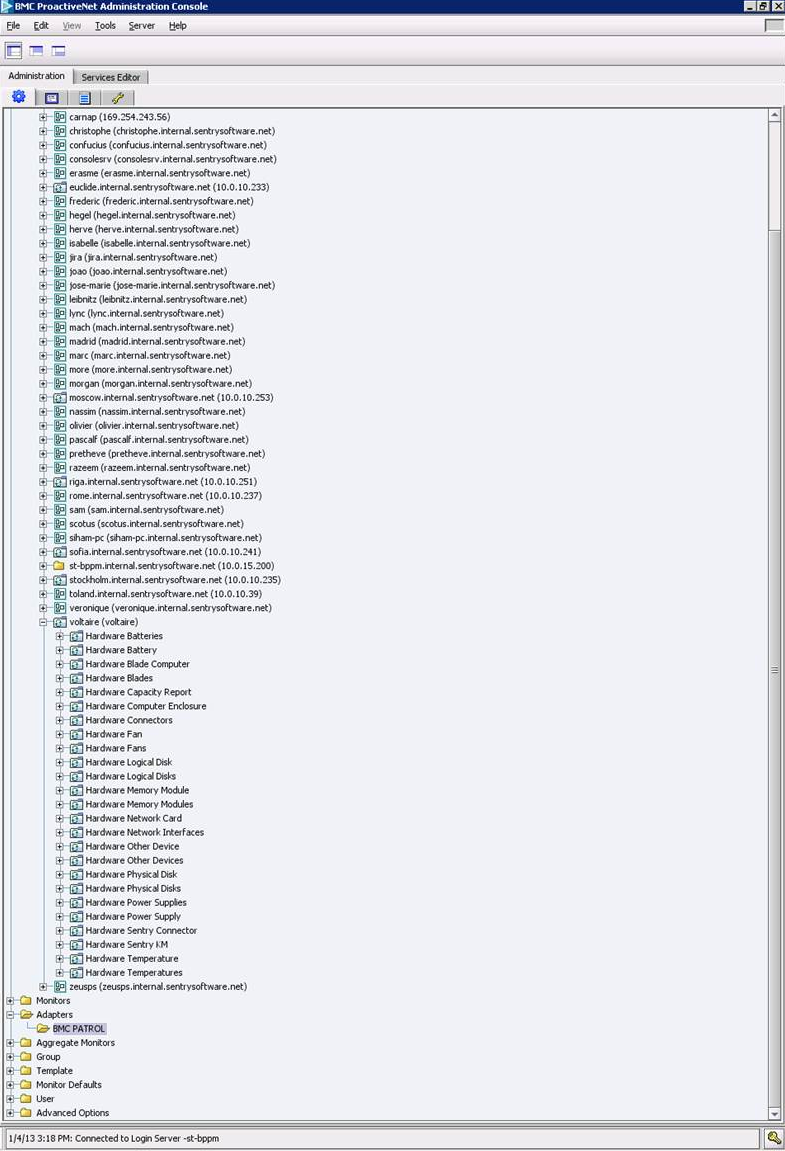
- Make sure the KMs are actually preloaded:
- Open the BMC ProactiveNet Administration Console:
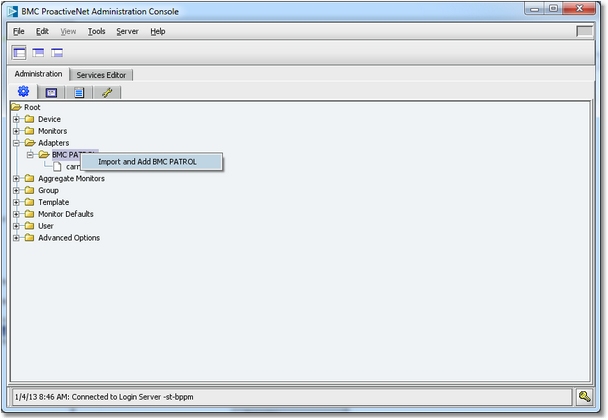
- Expand the Adapters folder, right-click BMC PATROL, and select Import and Add BMC PATROL. This action can also be performed from the menu Tools > Configure > Integration Service.
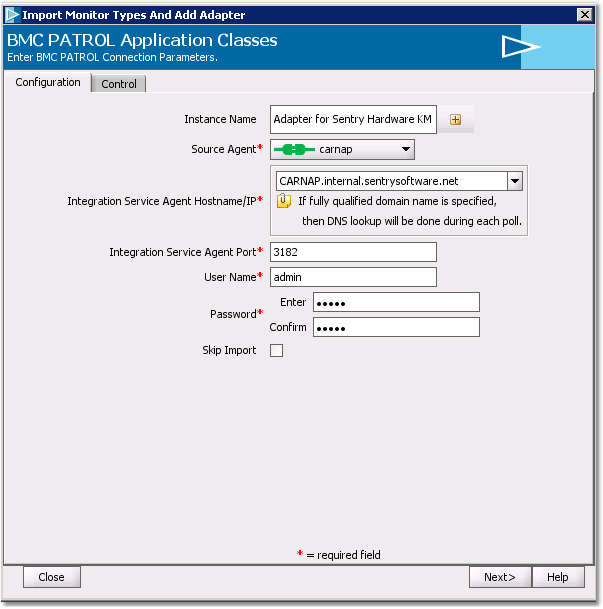
- Enter the required information:
- Instance Name: enter a name for this instance of the Adapter that will perform the integration of the ‘targeted KM’ into BMC ProactiveNet (e.g.: Adapter for Sentry Hardware KM).
- Source Agent: BPPM Remote Agent to which your PATROL agents are sending data to
- Enter the Integration Service Agent Hostname or IP address
- Enter the Integration Service Agent Port. The default port is 3182.
- User Name/ Password: Enter the required credentials to connect to the Integration Service Agent
- Click Next. If you have correctly set the integrationServices variable as explained above, your PATROL Agents will be listed:
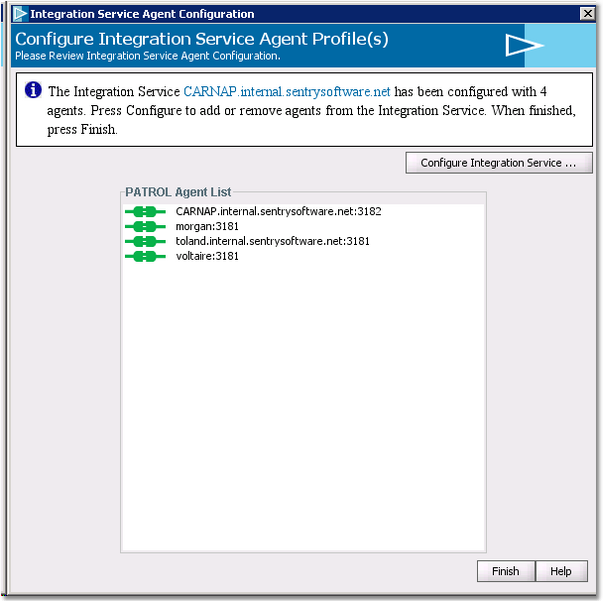
- Click Finish
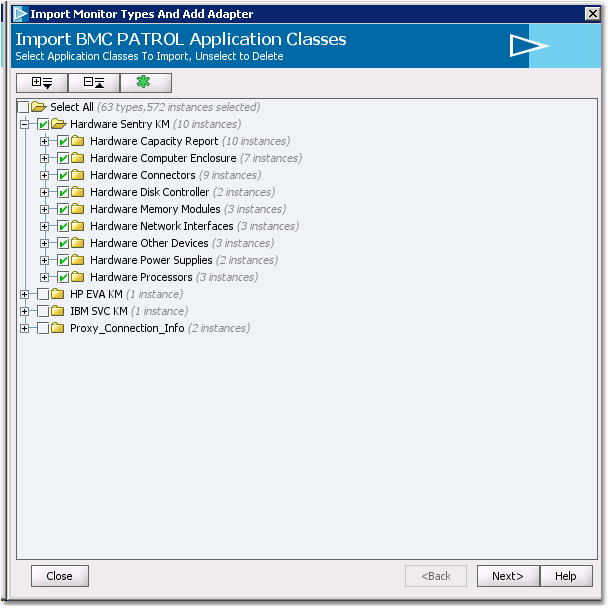
- Select the desired Application Classes to import and click Next
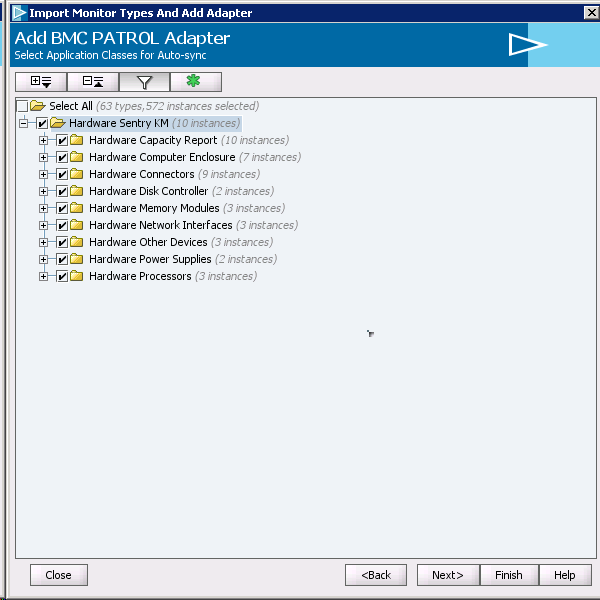
- Select the Application classes you wish to auto-synchronize with the Integration Service Agent and click Next
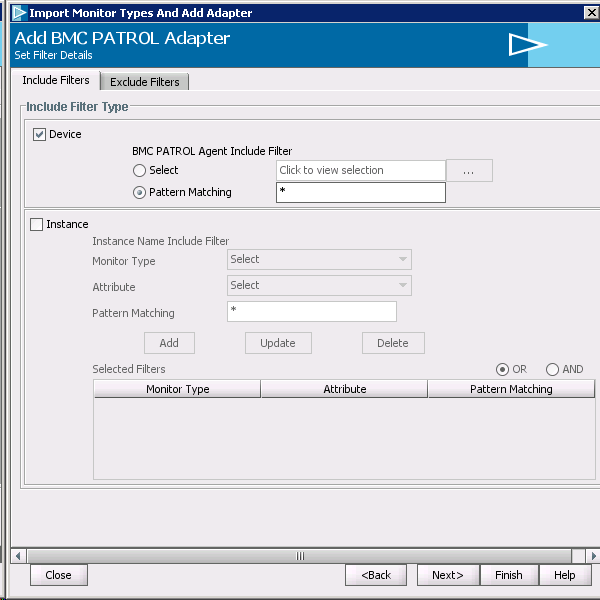
- If needed, set the Filter details and click Next
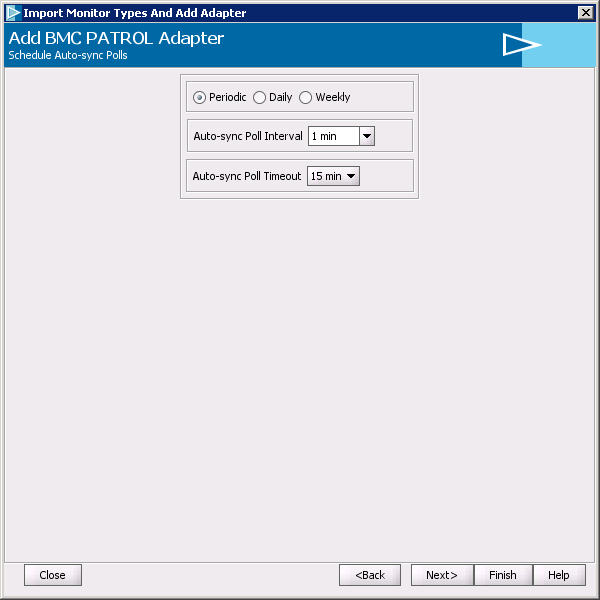
- If needed, set the Auto-sync Poll Interval and/or Timeout and click Next
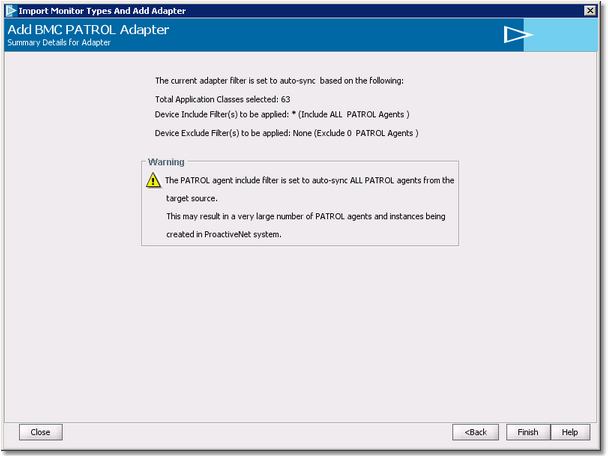
- Click Finish to create the adapter and trigger an autosync.
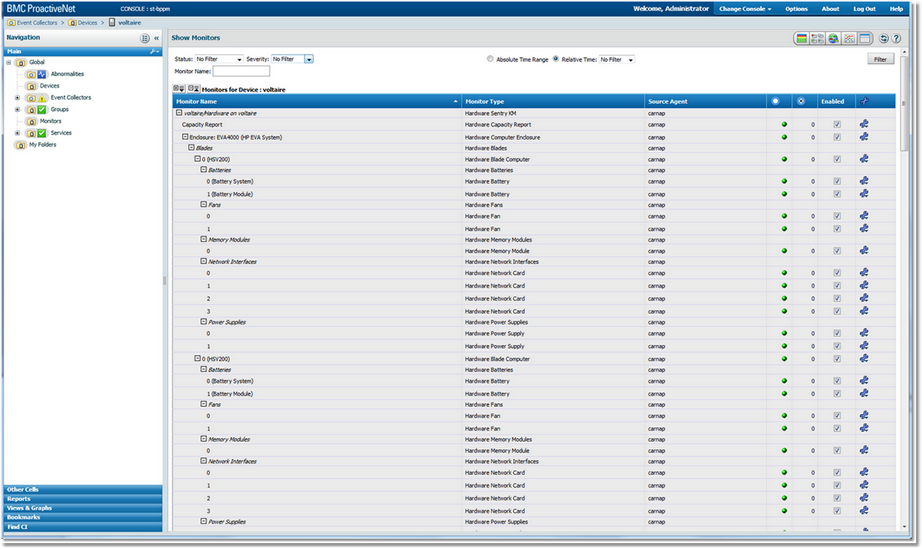
The newly added monitors should now appear under your device in BMC ProactiveNet Administration Console:
And in BMC ProactiveNet Operations console:
Step 2: Importing and Customizing Thresholds
- Launch the BMC ProactiveNet PW Commands.
On Windows 2008, you need to run the PW Commands as Administrator.
- Execute the following command line:
pw adapter -type patrol -get_thresholds <file name> -pproxy_host <hostname|ipaddress> [-pproxy_port <port_number>] [-pproxy_user <username>] [-pproxy_passwd <password>] -i -v
where
- get_thresholds <file name> = File name with absolute path at which thresholds will be imported
- pproxy_host <hostname|ipaddress> = Host name or IP Address of Patrol Proxy Server
- proxy_port <port_number> = Port at which Patrol Proxy Agent communicates with Patrol Proxy Server
- pproxy_user <username> = User name of Patrol Proxy user
- pproxy_passwd <password> = Password to authenticate Patrol Proxy user
- i = import Instance level thresholds
- v = run in "verbose" mode, producing extra lines of output during extraction and conversion processes
C:\>pw adapter -type patrol -get_thresholds c: hresholds.txt -pproxy_host carnap -pproxy_port 3182 -pproxy_user admin -pproxy_passwd ***** -i -v
The command has produced a text file with all the parameter threshold settings. - get_thresholds <file name> = File name with absolute path at which thresholds will be imported
- Open the file in a text editor and search for the “NOT_IMPLEMENTED” occurrences to detect thresholds that could not be imported by BPPM:
# GLOBAL THRESHOLDS
# Application class : MS_HW_FAN , Parameter : Speed
# Threshold range : 0 0 0 0 0 0 OK|1 0 0 1 1 0 ALARM|1 0 1440 1 1 0 WARN|, Mapping Status : NOT_IMPLEMENTED
_PATROL__MS_HW_MAIN_MS_HW_ENCLOSURE_MS_HW_FAN_CONT_MS_HW_FAN SPEED MAJOR 0 below 1443 0 Auto# INSTANCE LEVEL THRESHOLDS
# Thresholds are already set for this parameter if you want to overwrite, uncomment it.
# Application class : MS_HW_FAN , Parameter : Speed
# Threshold range : 0 0 0 0 0 0 OK|1 0 0 1 1 0 ALARM|1 0 1443 1 1 0 WARN|, Mapping Status : NOT_IMPLEMENTED
# Instance Name : MS_HW_Director61NThdflocalhost_Fan1ATach2f2901f201f4501f5c (Fan 1A Tach:2f2901f201f4501f5c)
_PATROL__MS_HW_MAIN_MS_HW_ENCLOSURE_MS_HW_FAN_CONT_MS_HW_FAN|MS_HW_Director61NThdflocalhost_Fan1ATach2f2901f201f4501f5c (Fan 1A Tach:2f2901f201f4501f5c)|morgan.internal.sentrysoftware.net SPEED MAJOR 0 below 1443 0 Auto - Execute the following command to manually import the “NOT_IMPLEMENTED” thresholds:
pw threshold loadpatrolthreshold [<thresholdfilename> [-v]]
where:
- <thresholdfilename> is a thresholds file name. If no file path is specified then the default '<Installation Directory>/pw/tmp/' is used
- -v enables the Verbose mode
pw threshold loadpatrolthreshold c: hresholds_to_import.txt -v
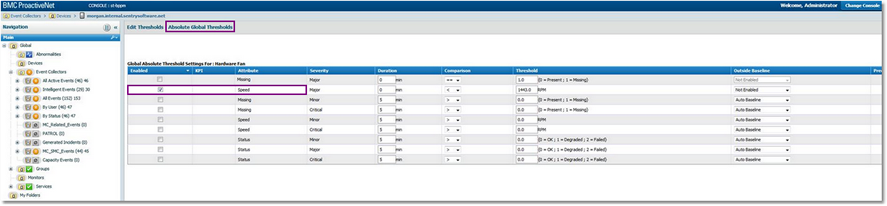
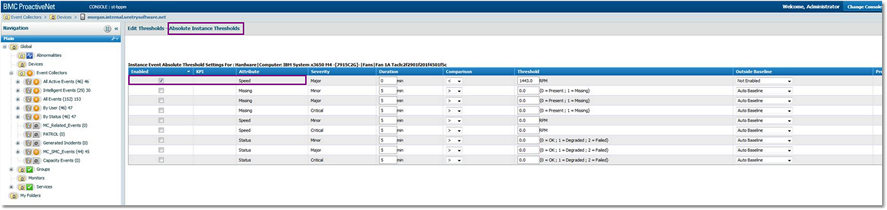
- Check the result in the BMC ProactiveNet Operations Console:
# GLOBAL THRESHOLDS
# INSTANCE LEVEL THRESHOLDS
For more information on how to import PATROL thresholds, refer to this knowledge article: Questions on pw thresholds command.
Step 3: Verifying the Data Collection
You can check that data collection is performed at the BPPM Integration Service and BPPM server levels:
- Either by running a command on the BPPM Remote Agent machine where the Integration Service is running
- Or through the Operations console.
Method 1: Running a Command
- On the BPPM Remote Agent machine where the Integration Service is running, launch the command prompt
- Go to BPPMAgent\Agent\pproxy\PNS\bin
- Run the following command:
pproxcli >c:\pprox.txtExample:
/connect -host <BPPM_integration_service_hostname> -port <port> -username <username> -password <password>
/connect -host carnap -port 3182 -username admin -password ******
- Run the following command: /PATROL/query/getInstanceData -agent <patrol_agent>:<port>Example:
/PATROL/query/getInstanceData -agent morgan:3181
- Check the output (c:\pprox.txt). It should look as follows:
AGENT_NAME=morgan:3181
APPL=MS_HW_FAN
INST_NAME=MS_HW_Director61NThdflocalhost_Fan1ATach2f2901f201f4501f5c
PARAM_NAME=Speed
PARAM_VALUE=2775.000000
TIMESTAMP=1357554769
INST_NAME=MS_HW_Director61NThdflocalhost_Fan1BTach3f2901f201f4501f5c
PARAM_NAME=Speed
PARAM_VALUE=2336.000000
TIMESTAMP=1357554769
INST_NAME=MS_HW_Director61NThdflocalhost_Fan2ATach4f2901f201f4501f5c
PARAM_NAME=Speed
PARAM_VALUE=2775.000000
TIMESTAMP=1357554769
INST_NAME=MS_HW_Director61NThdflocalhost_Fan2BTach5f2901f201f4501f5c
PARAM_NAME=Speed
PARAM_VALUE=2336.000000
TIMESTAMP=1357554769
INST_NAME=MS_HW_Director61NThdflocalhost_Fan3ATach6f2901f201f4501f5c
PARAM_NAME=Speed
PARAM_VALUE=2812.000000
TIMESTAMP=1357554769
INST_NAME=MS_HW_Director61NThdflocalhost_Fan3BTach7f2901f201f4501f5c
PARAM_NAME=Speed
PARAM_VALUE=2368.000000
TIMESTAMP=1357554769Note: The timestamp is in EPOCH format so TIMESTAMP=1357554769 means “GMT: Mon, 07 Jan 2013 10:32:49 GMT”. - To get more information about the data collection status, run the following commands:
1 /PATROL/config/listAgent List the agents 2 /PATROL/query/getAgentDetails -agent ALL Get all the agent details 3 /PATROL/query/getMonitorDetails -agent ALL Get all the monitor details 4 /PATROL/query/getMonitorInstanceDetails -agent ALL Get the monitor instance details 5 /PATROL/query/getInstanceData -agent ALL Get instance data for all patrol agents 6 /PATROL/query/getInstanceData -agent <agent_name>:<port_number> -appl <application_name> -inst <instance_name> -param <parameter_name> Get instance data for given agent. Application name, instance name and parameter name are optional
Method 2: Through the BMC ProactiveNet Operations Console
- In the Navigation pane, click Devices.
- Click
 to display the Grid View
 - Select the monitor/parameter for which you want to check the data collection status
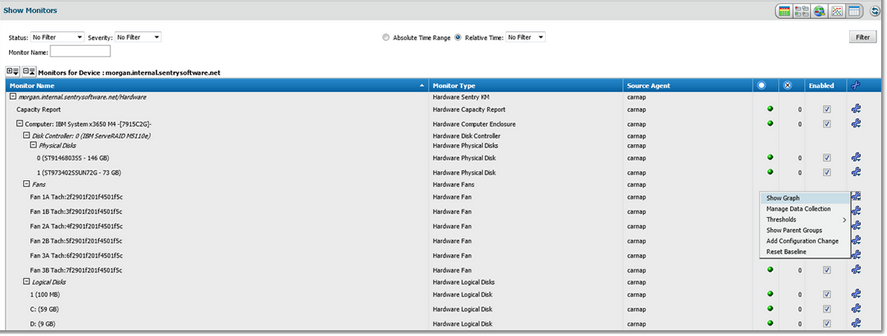
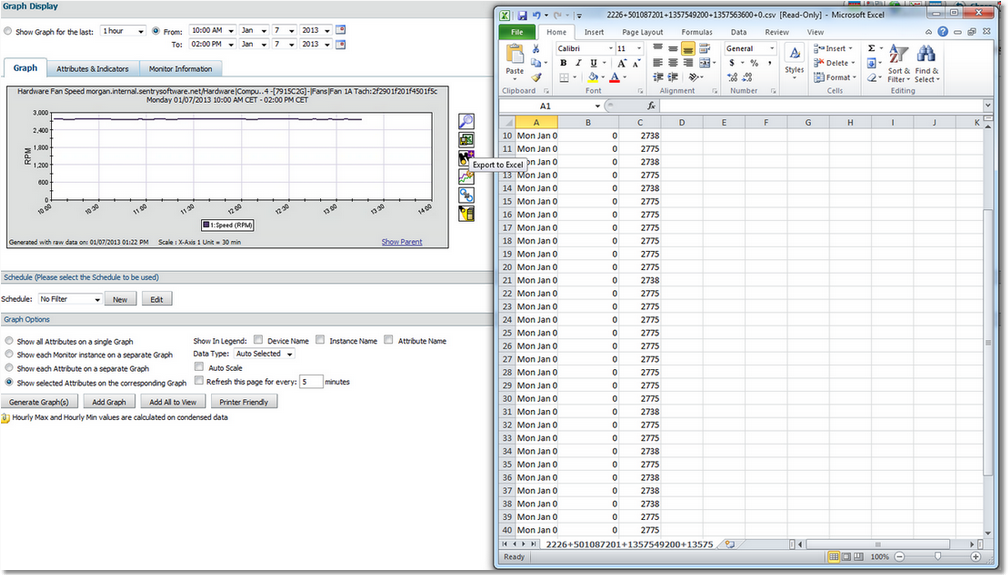
- Click Show Graph and
 Export to Excel to get the list of all the data collection points between a selected time frame:
For more information about how to check the data collection in the BPPM database, please refer to this knowledge article: How to check the data collection in BPPM database