Table of Contents
Introduction
You can monitor the hardware health of your Dell PowerEdge servers, from 11th generation (11G) up to the latest generation (17G), in BMC Helix Operations Management using Hardware Sentry KM.
Depending on the server generation and management capabilities, you will use either out-of-band (agentless) or in-band (agent-based) monitoring.
In the sections that follow, you will learn how to identify the appropriate monitoring method based on your server generation and how to configure it in BMC Helix Operations Management.
Step 1: Identify the Server Generation
Before monitoring your Dell PowerEdge server, you must first identify its server generation, as it determines:
- whether out-of-band (agentless) monitoring is supported through iDRAC
- which monitoring protocols can be used (HTTP/REST, SNMP, or in-band agents).
To identify the server generation, look at the middle digit of the model number. This digit maps directly to the PowerEdge generation and the corresponding iDRAC version.
For example, in the model name PowerEdge R750 with iDRAC9, the middle digit (5) indicates that it is a rack-mounted PowerEdge server (R) using iDRAC9, and that it belongs to the 15th generation (15G).
The tables below provide non-exhaustive examples of Dell PowerEdge platforms, grouped by server type and generation. In each model name, the generation digit is highlighted in red to show how the middle digit maps directly to the PowerEdge generation and the associated iDRAC version.
Rack Servers (R) and Hyperconverged Servers (XC)
| Models | PowerEdge Generation | iDRAC Version | Supported Protocols |
|---|---|---|---|
| R670, R470, XC770 / XC770xd | 17G | iDRAC10 | HTTP/REST, SNMP |
| R660, R760, XC760 / XC760xd | 16G | iDRAC9 | HTTP/REST, SNMP |
| R650, R750, XC750 / XC750xd | 15G | iDRAC9 | HTTP/REST, SNMP |
| R640, R740, XC740 / XC740xd | 14G | iDRAC9 | HTTP/REST, SNMP |
| R630, R730, XC630 | 13G | iDRAC8 | SNMP |
| R620, R720 | 12G | iDRAC7 | SNMP |
| R610, R710 | 11G | iDRAC6 | In-band (OMSA) |
Modular Systems — MX Series (MX7000 Platform)
| Models | PowerEdge Generation | iDRAC Version | Supported Protocols |
|---|---|---|---|
| MX770c | 17G | iDRAC10 | HTTP/REST, SNMP |
| MX760c | 16G | iDRAC9 | HTTP/REST, SNMP |
| MX750c | 15G | iDRAC9 | HTTP/REST, SNMP |
Blade Modular Systems — M Series (M1000e Platform)
| Models | PowerEdge Generation | iDRAC Version | Supported Protocols |
|---|---|---|---|
| M640 | 14G | iDRAC9 | HTTP/REST, SNMP |
| M630 | 13G | iDRAC8 | SNMP |
| PowerEdge M1000e | — | — | DRAC/MC |
Step 2: Configure Your Monitoring Policy in BMC Helix Operations Management
Using Out-of-Band Monitoring via iDRAC
Requirements
Before configuring a monitoring policy in BMC Helix Operations Management, make sure that:
- Hardware Sentry KM v11.4.x or v20.x is installed on the host where the PATROL Agent is running
- The required Java version is available on the same host:
- Java 1.8.x or later for Hardware Sentry KM v11.4.x
- Java 11 or later for Hardware Sentry KM v20.x
- You know the iDRAC IP address or hostname and have valid credentials to access the iDRAC management interface
- You know the Dell PowerEdge server hostname or FQDN, which is used by BMC Helix Operations Management or TrueSight Operations Management to identify the monitored device.
Note: Out-of-band monitoring via iDRAC requires a remote host configuration.
Localhost-based configurations are not supported.
Via iDRAC using the HTTP/REST Protocol (Modern PowerEdge 14G to 17G and later)
Before configuring your monitoring policy, run the command below to validate your settings:
curl -k -H "Content-Type: application/json" -u <username> -X GET https://<hostname>:443/redfish/v1
Replace <username>, <hostname>, <port> with appropriate values. Port is 443 by default.
You’ll be prompted to enter the Password
If the command is successful:
-
Log in to BMC Helix Operations Management or BMC TrueSight Operations Management.
-
Create a new monitoring policy or edit an existing one:
- Specify the general properties and agent selection criteria
- Add a monitoring configuration
- Select the Hardware solution
-
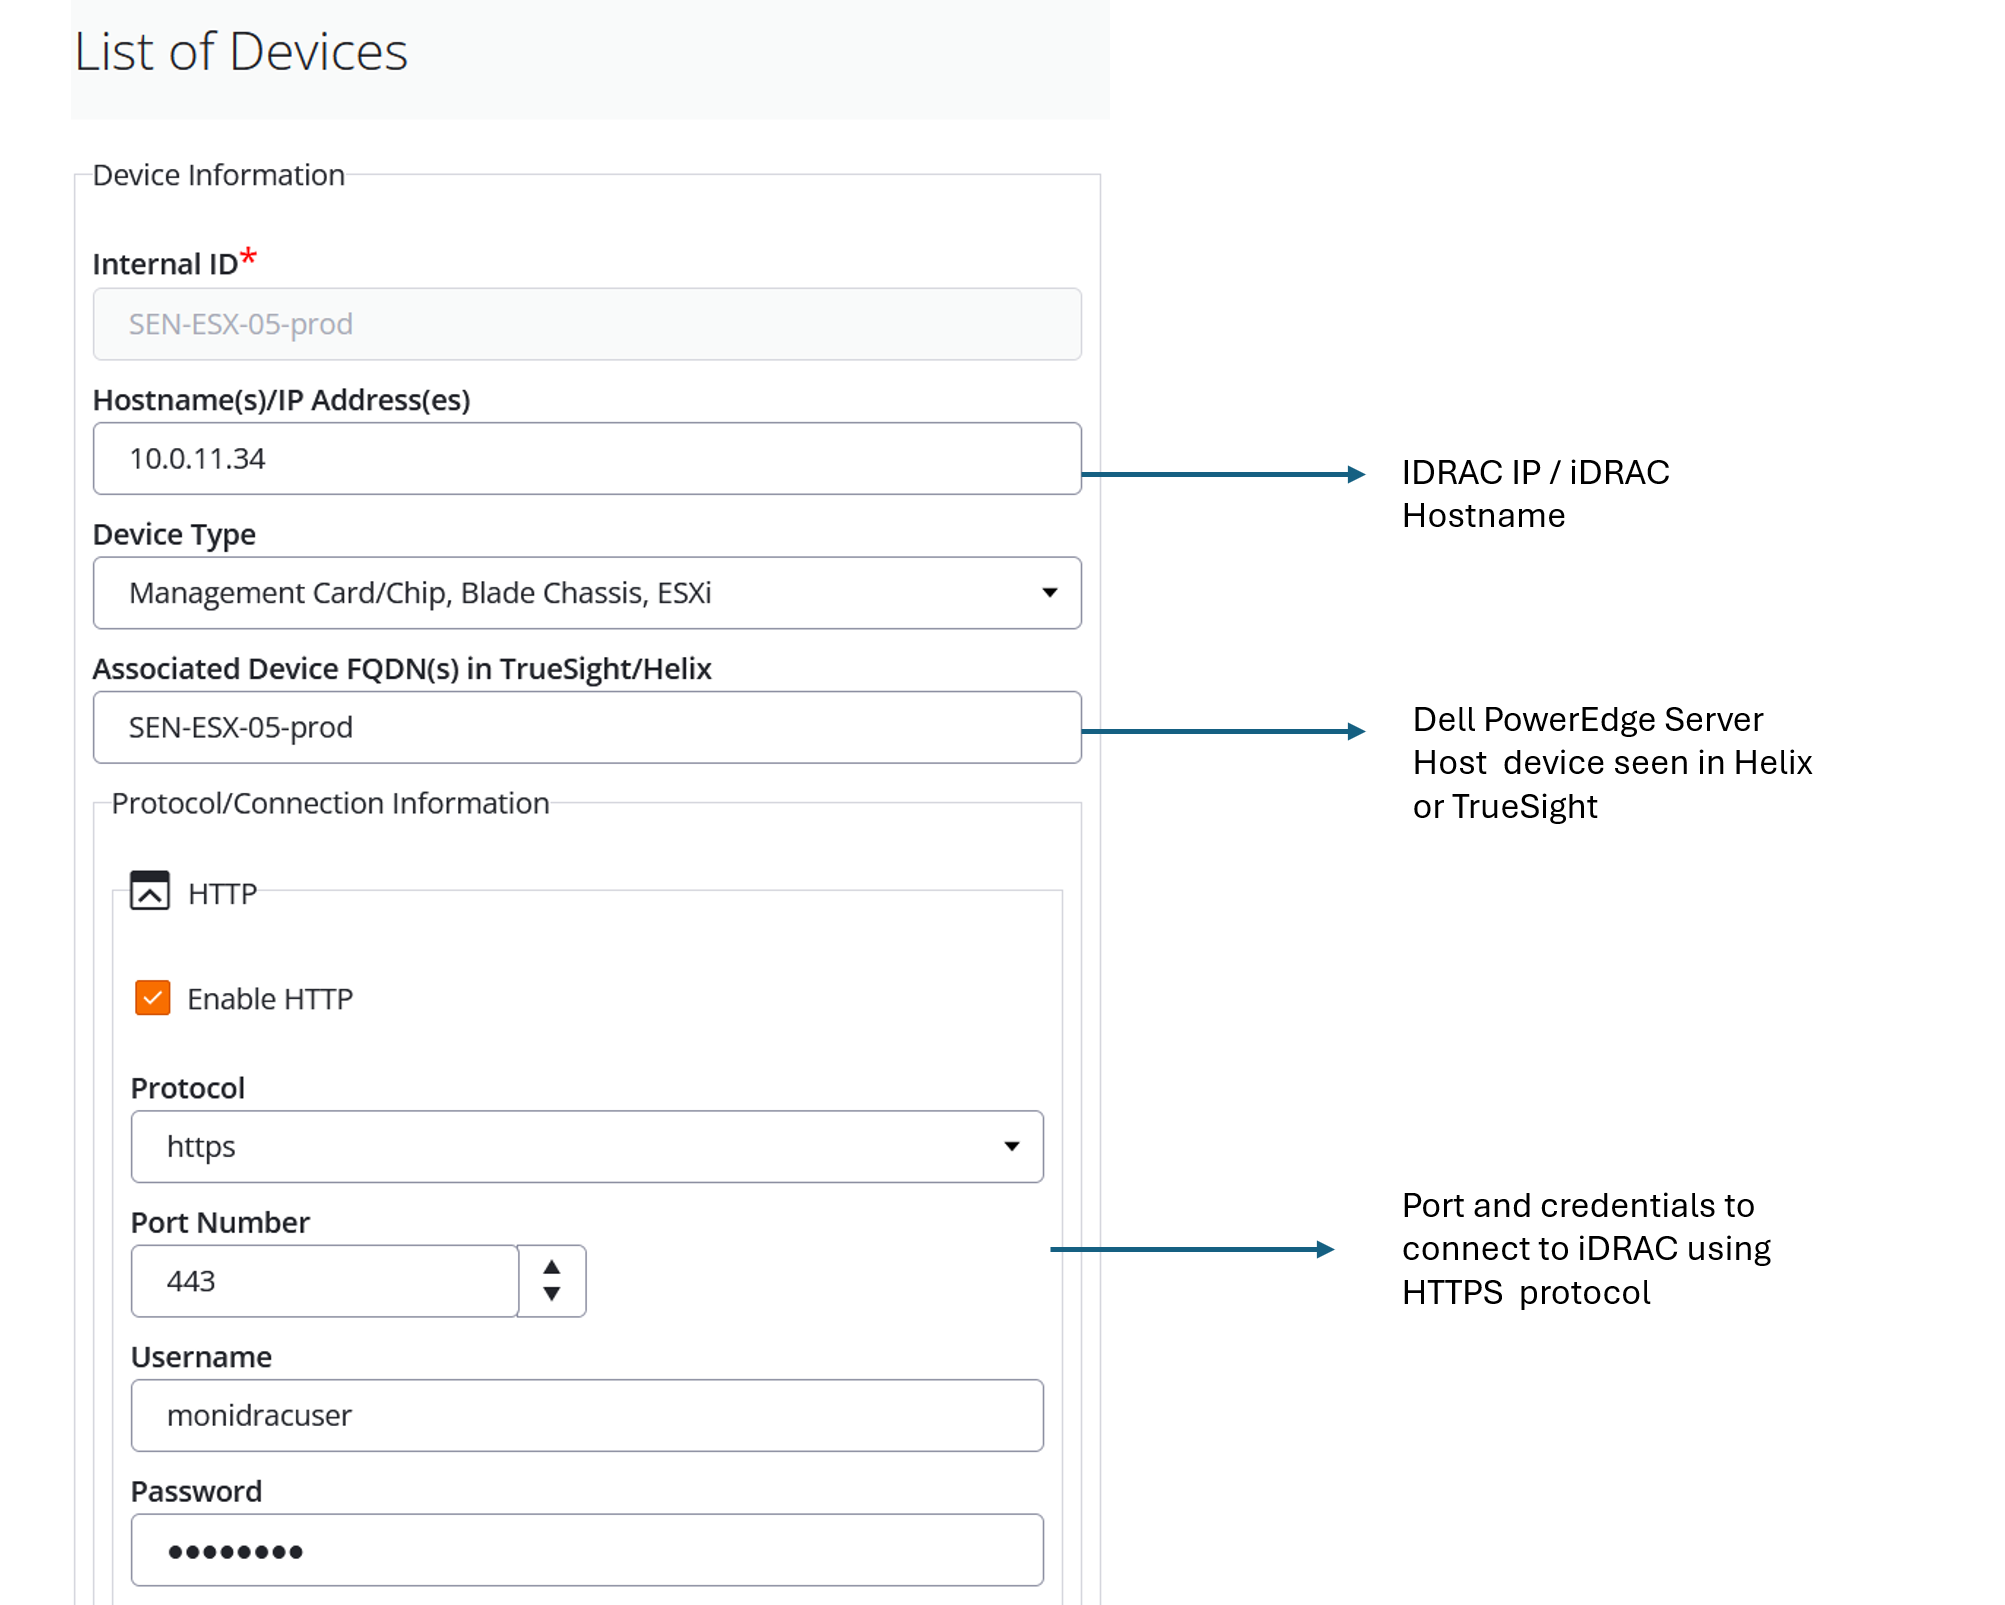
In the Hardware Configuration section, click Add to create a new Device, then provide the:
- Internal ID: A unique identifier for the device in the policy (avoid special characters)
- Hostname/IP Address(es): The hostname or IP address of the iDRAC management interface
- Device Type: Select the appropriate type (e.g., Management Card/Chip, Blade Chassis, ESXi)
- Associated Device FQDN(s): The hostname or FQDN of the server whose hardware is monitored through iDRAC
Via iDRAC using the SNMP Protocol
Before configuring a monitoring policy in BMC Helix Operations Management, make sure that:
- You know the iDRAC IP address or hostname and have valid credentials to access the iDRAC management interface
- You know the Dell PowerEdge server hostname or FQDN, which is used by BMC Helix Operations Management or TrueSight Operations Management to identify and associate the monitored device (for example, linking it with ESXi server monitoring)
- SNMP polling (port 161) is configured in iDRAC.
First, use MS_HW_matsya-module-snmpclient.jar to confirm that SNMP is properly configured in iDRAC (SNMP v3 in our example):
java -jar MS_HW_matsya-module-snmpclient.jar -v3 -host:<idrac-host-or-idracip> -authType:<MD5|SHA> -username:<authusername> -password:<password> -privType:<DES|AES> -privpassword:<password> -getNext:<OID>
Where <idrac-host-or-idracip> is the IP or HOSTNAME of the iDRAC management interface.
If using the authentication protocol V3, choose either MD5 or SHA for the authentication type.
In the example below, we are testing the SNMPV3 polling communication on iDRAC 10.0.11.34 using SHA as authType, snmpv3user and its password xxxxxx, and AES as PrivType:
java -jar MS_HW_matsya-module-snmpclient.jar -v3 -host:10.0.11.34 -authType:SHA -username:snmpv3user -password:xxxxxxx -privType:AES -privpassword:xxxxxxxx -getNext:1.3.6.1.4.1.674.10892.5.4
If the above commands are successful:
-
Log in to BMC Helix Operations Management or BMC TrueSight Operations Management.
-
Create a new monitoring policy or edit an existing one:
- Specify the general properties and agent selection criteria
- Add a monitoring configuration
- Select the Hardware solution
-
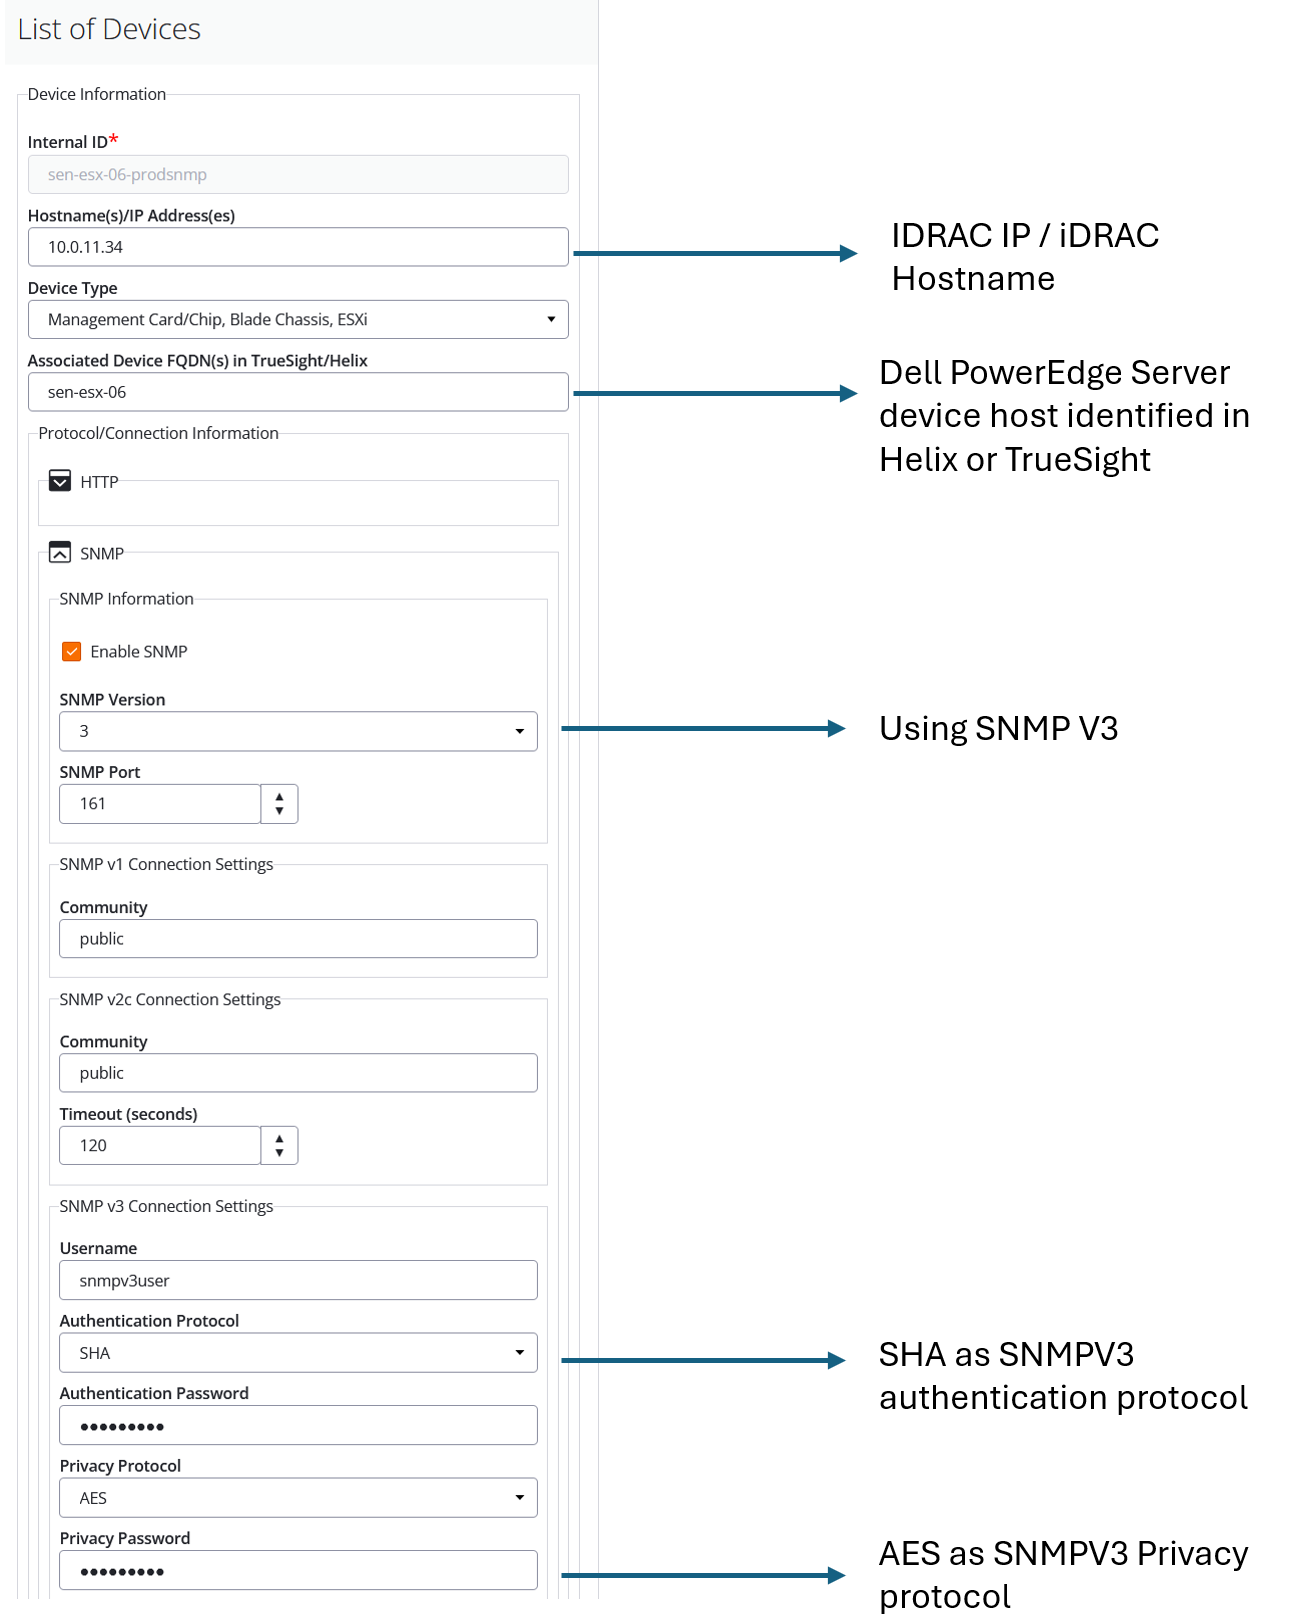
In the Hardware Configuration section, click Add to create a new Device, then provide the:
- Internal ID: A unique identifier for the device in the policy (avoid special characters)
- Hostname/IP Address(es): The hostname or IP address of the iDRAC management interface
- Device Type: Select the appropriate type (e.g., Management Card/Chip, Blade Chassis, ESXi)
- Associated Device FQDN(s): The hostname or FQDN of the server whose hardware is monitored through iDRAC.
Using OpenManage Enterprise – Modular (OME-M)
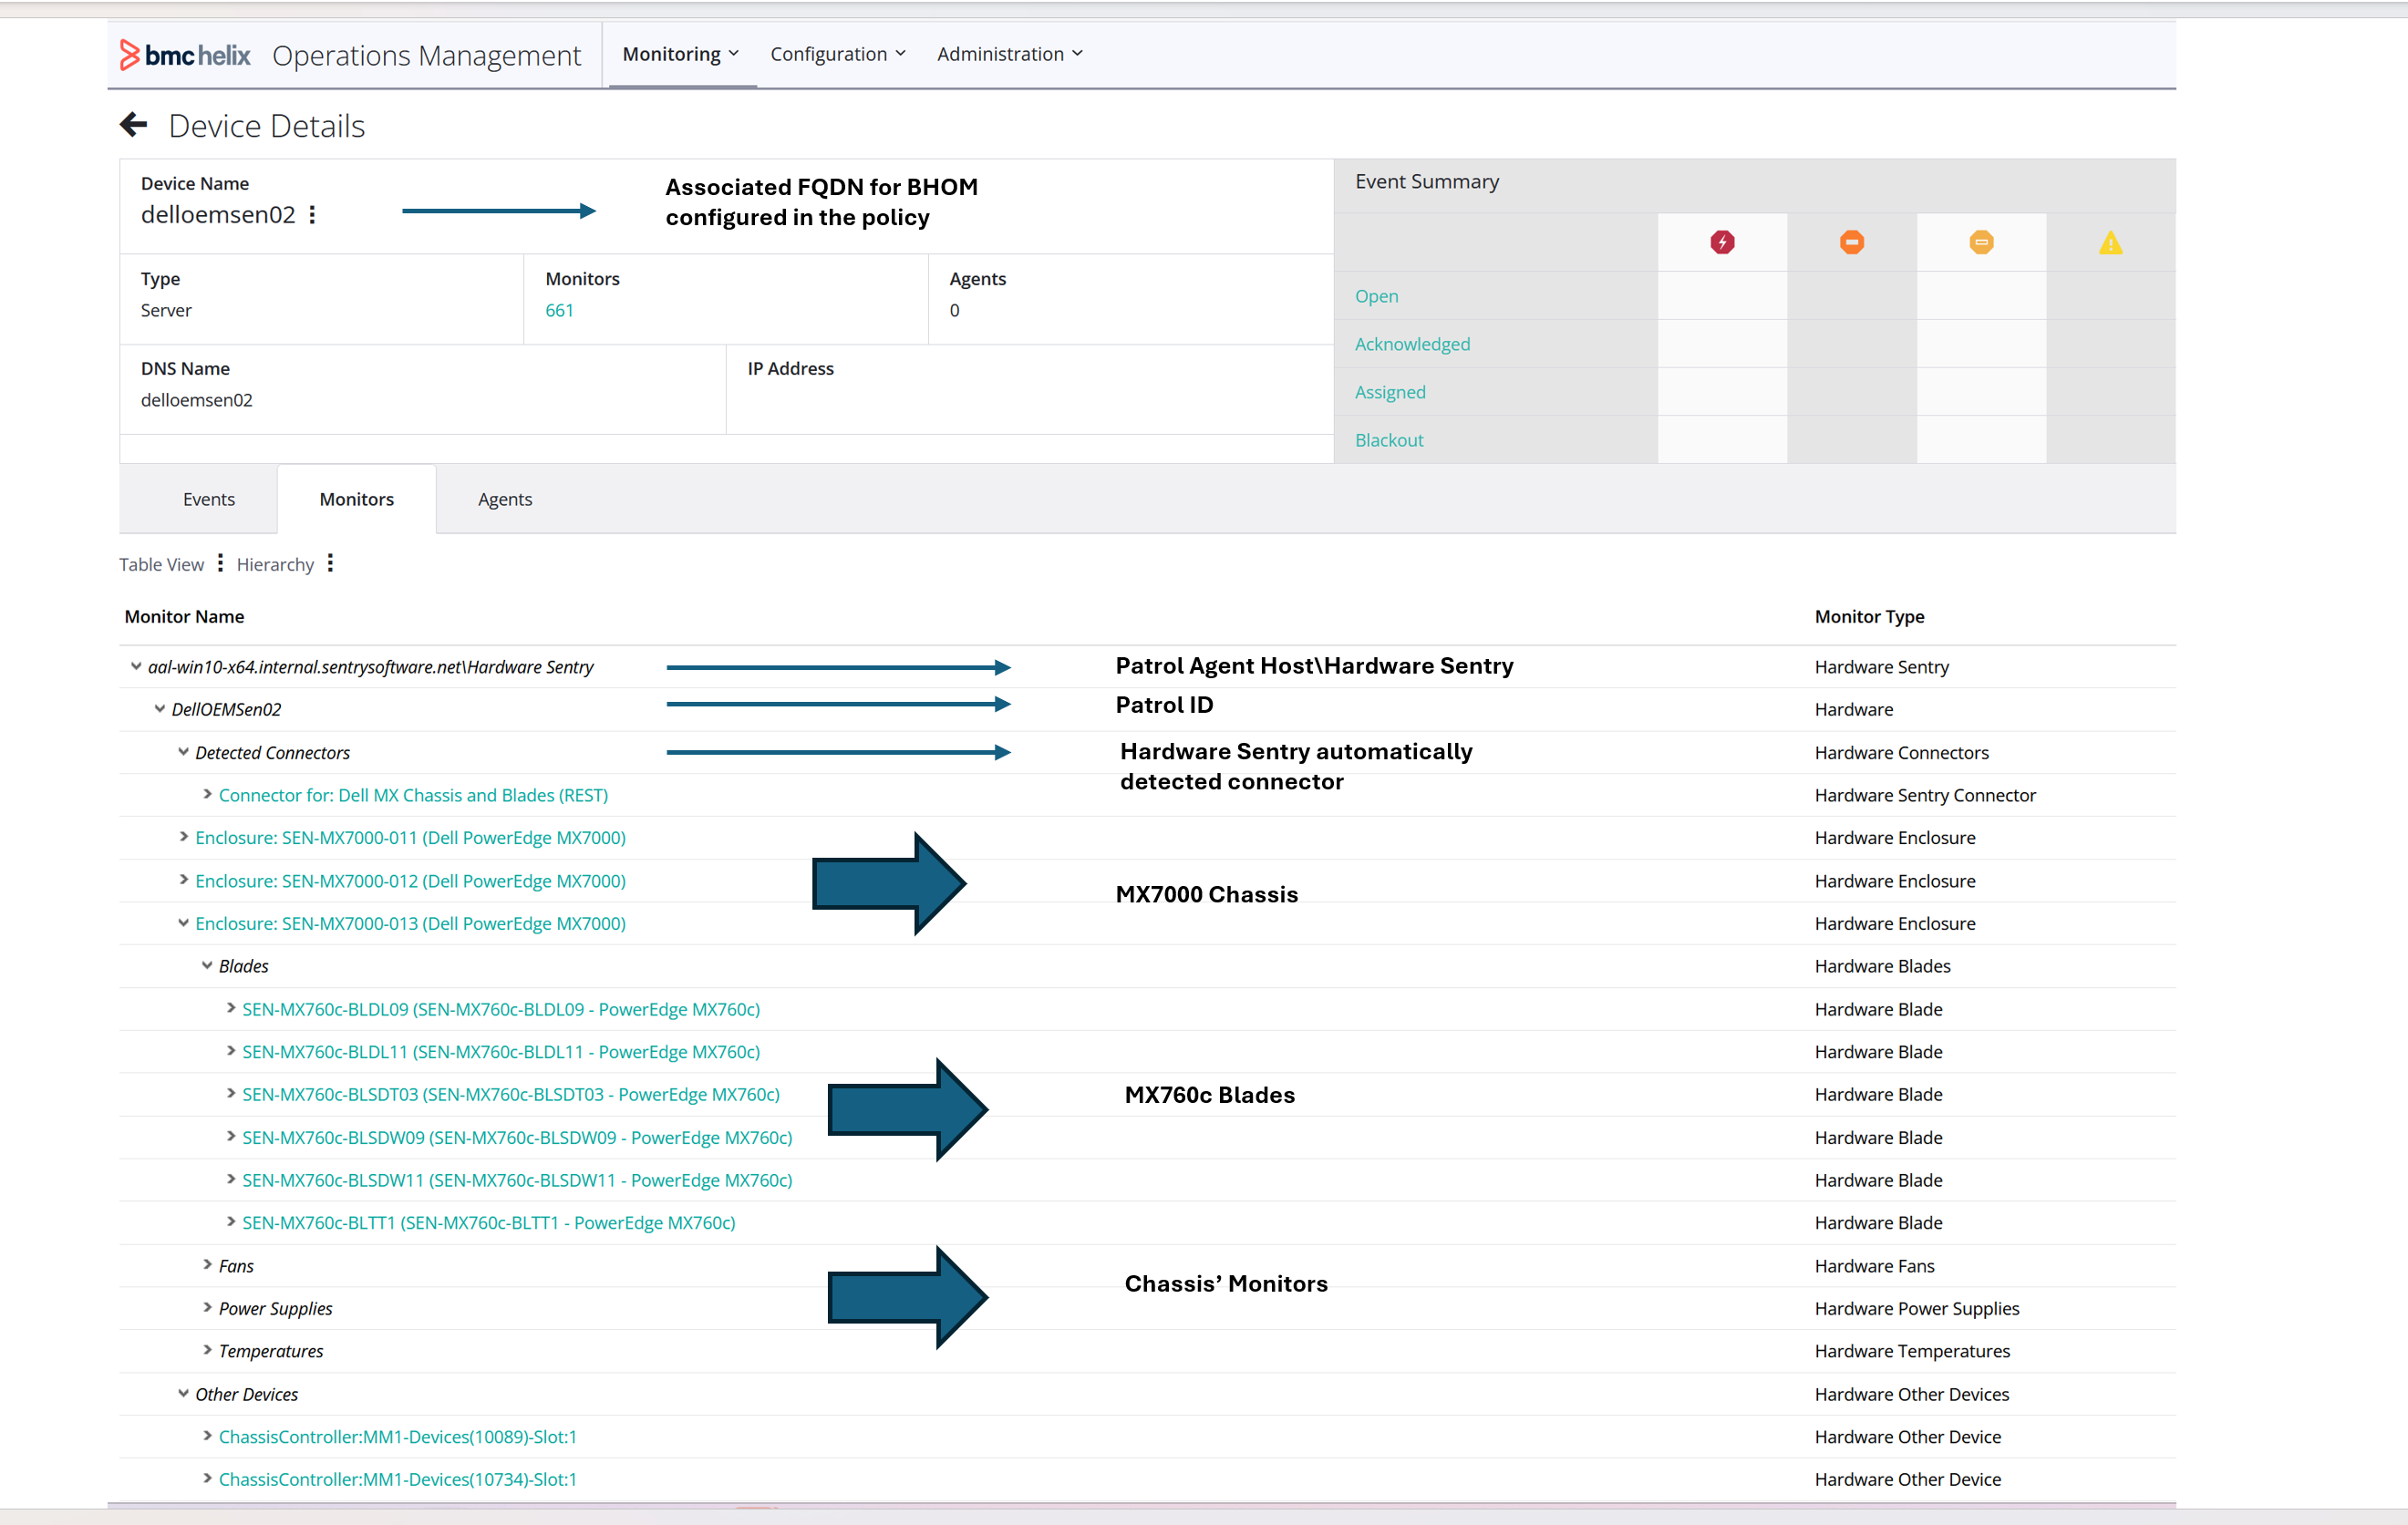
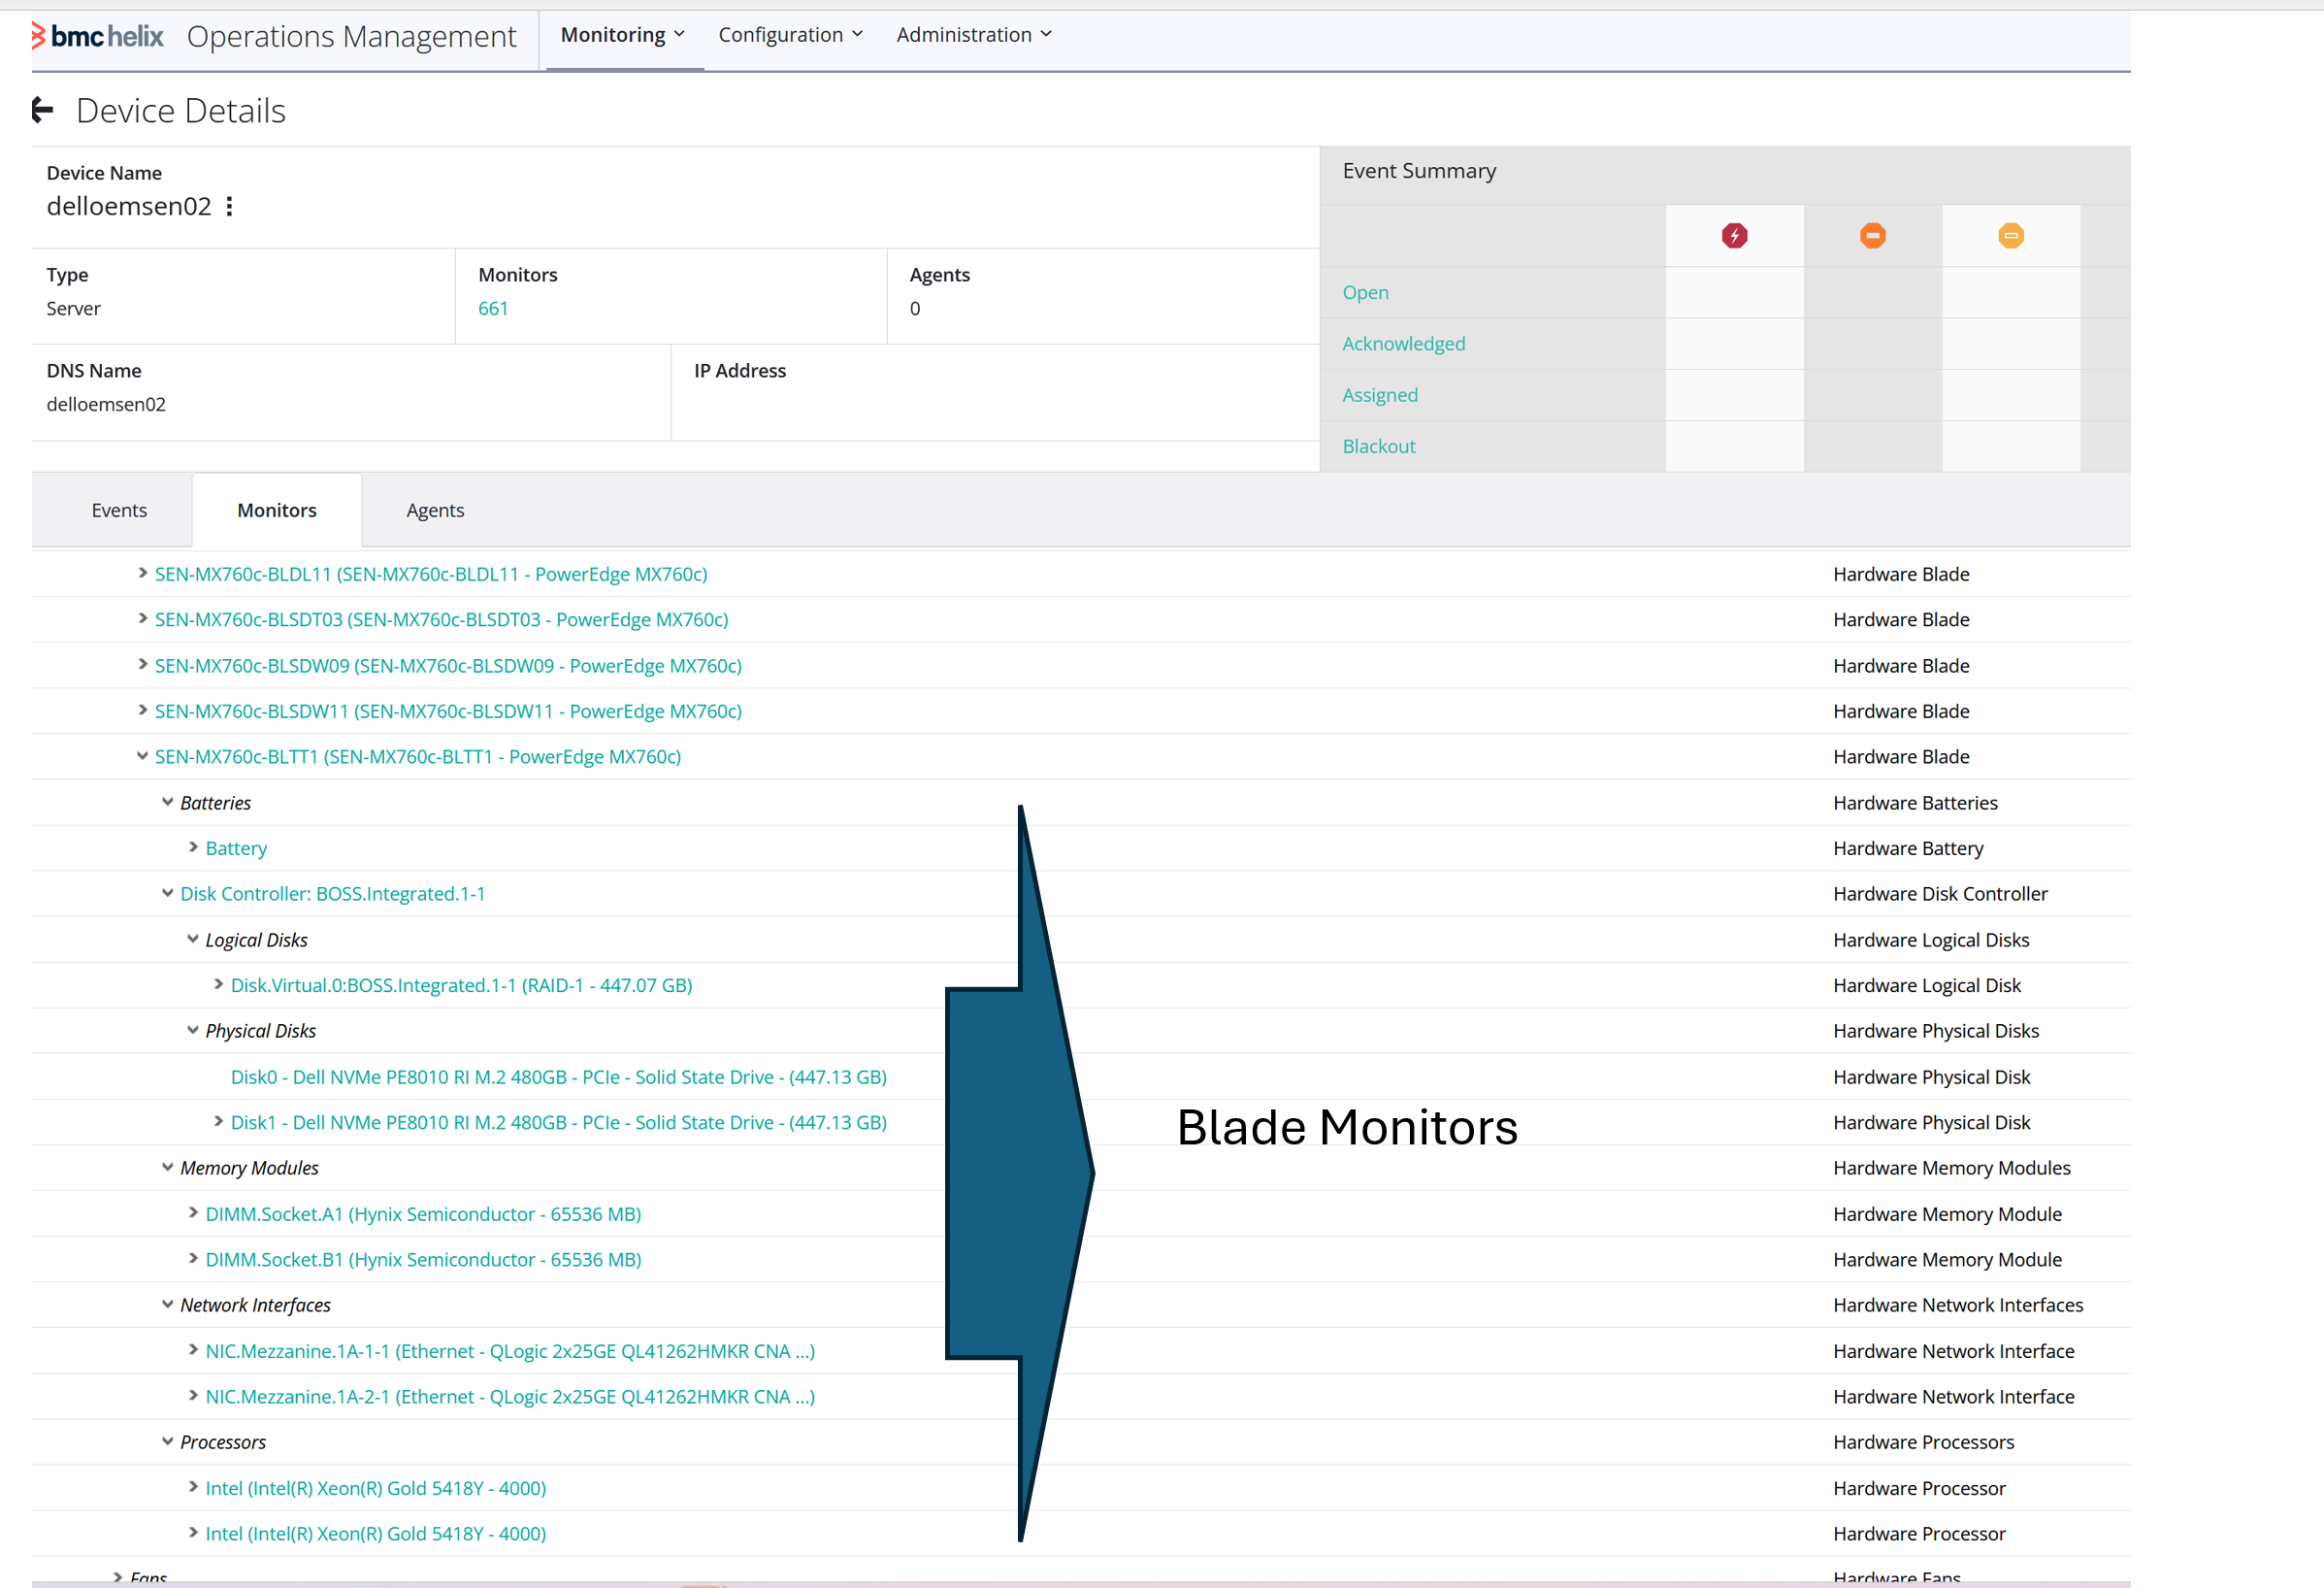
Dell PowerEdge MX Series are modular compute sleds designed to operate inside the Dell MX7000 chassis. Each compute sled is managed at the node level via iDRAC, while OpenManage Enterprise – Modular (OME-M) provides centralized, chassis-level, out-of-band management and monitoring for all MX components.
In this configuration, hardware monitoring is performed out-of-band via OME-M using the HTTP/REST (Redfish) protocol. OME-M acts as the single entry point to monitor both the MX7000 chassis and all associated MX compute sleds.
Requirements
Before configuring a monitoring policy in BMC Helix Operations Management, make sure that:
- You know the hostname or IP address of OpenManage Enterprise – Modular (OME-M)
- You have valid credentials to authenticate to OME-M
- Port 443 is enabled (default port for HTTPS)
First, run the below command to validate your settings:
curl -k -u <username> -H "Accept: application/json" https://<ome-m-host>/api/DeviceService/Devices
Replace:
<ome-m-host>by OpenManage Enterprise - Modular hostname or IP<username>by a user authorized to connect the OpenManage Enterprise - Modular API.
You will be prompted to enter the password.
In the example below, <10.0.203.239> is the OME-M IP address, <patrol> is the user to connect the OpenManage Enterprise - Modular API.

Procedure
If the above command is successful:
-
Log in to BMC Helix Operations Management or BMC TrueSight Operations Management.
-
Create a new monitoring policy or edit an existing one:
- Specify the general properties and agent selection criteria
- Add a monitoring configuration
- Select the Hardware solution
-
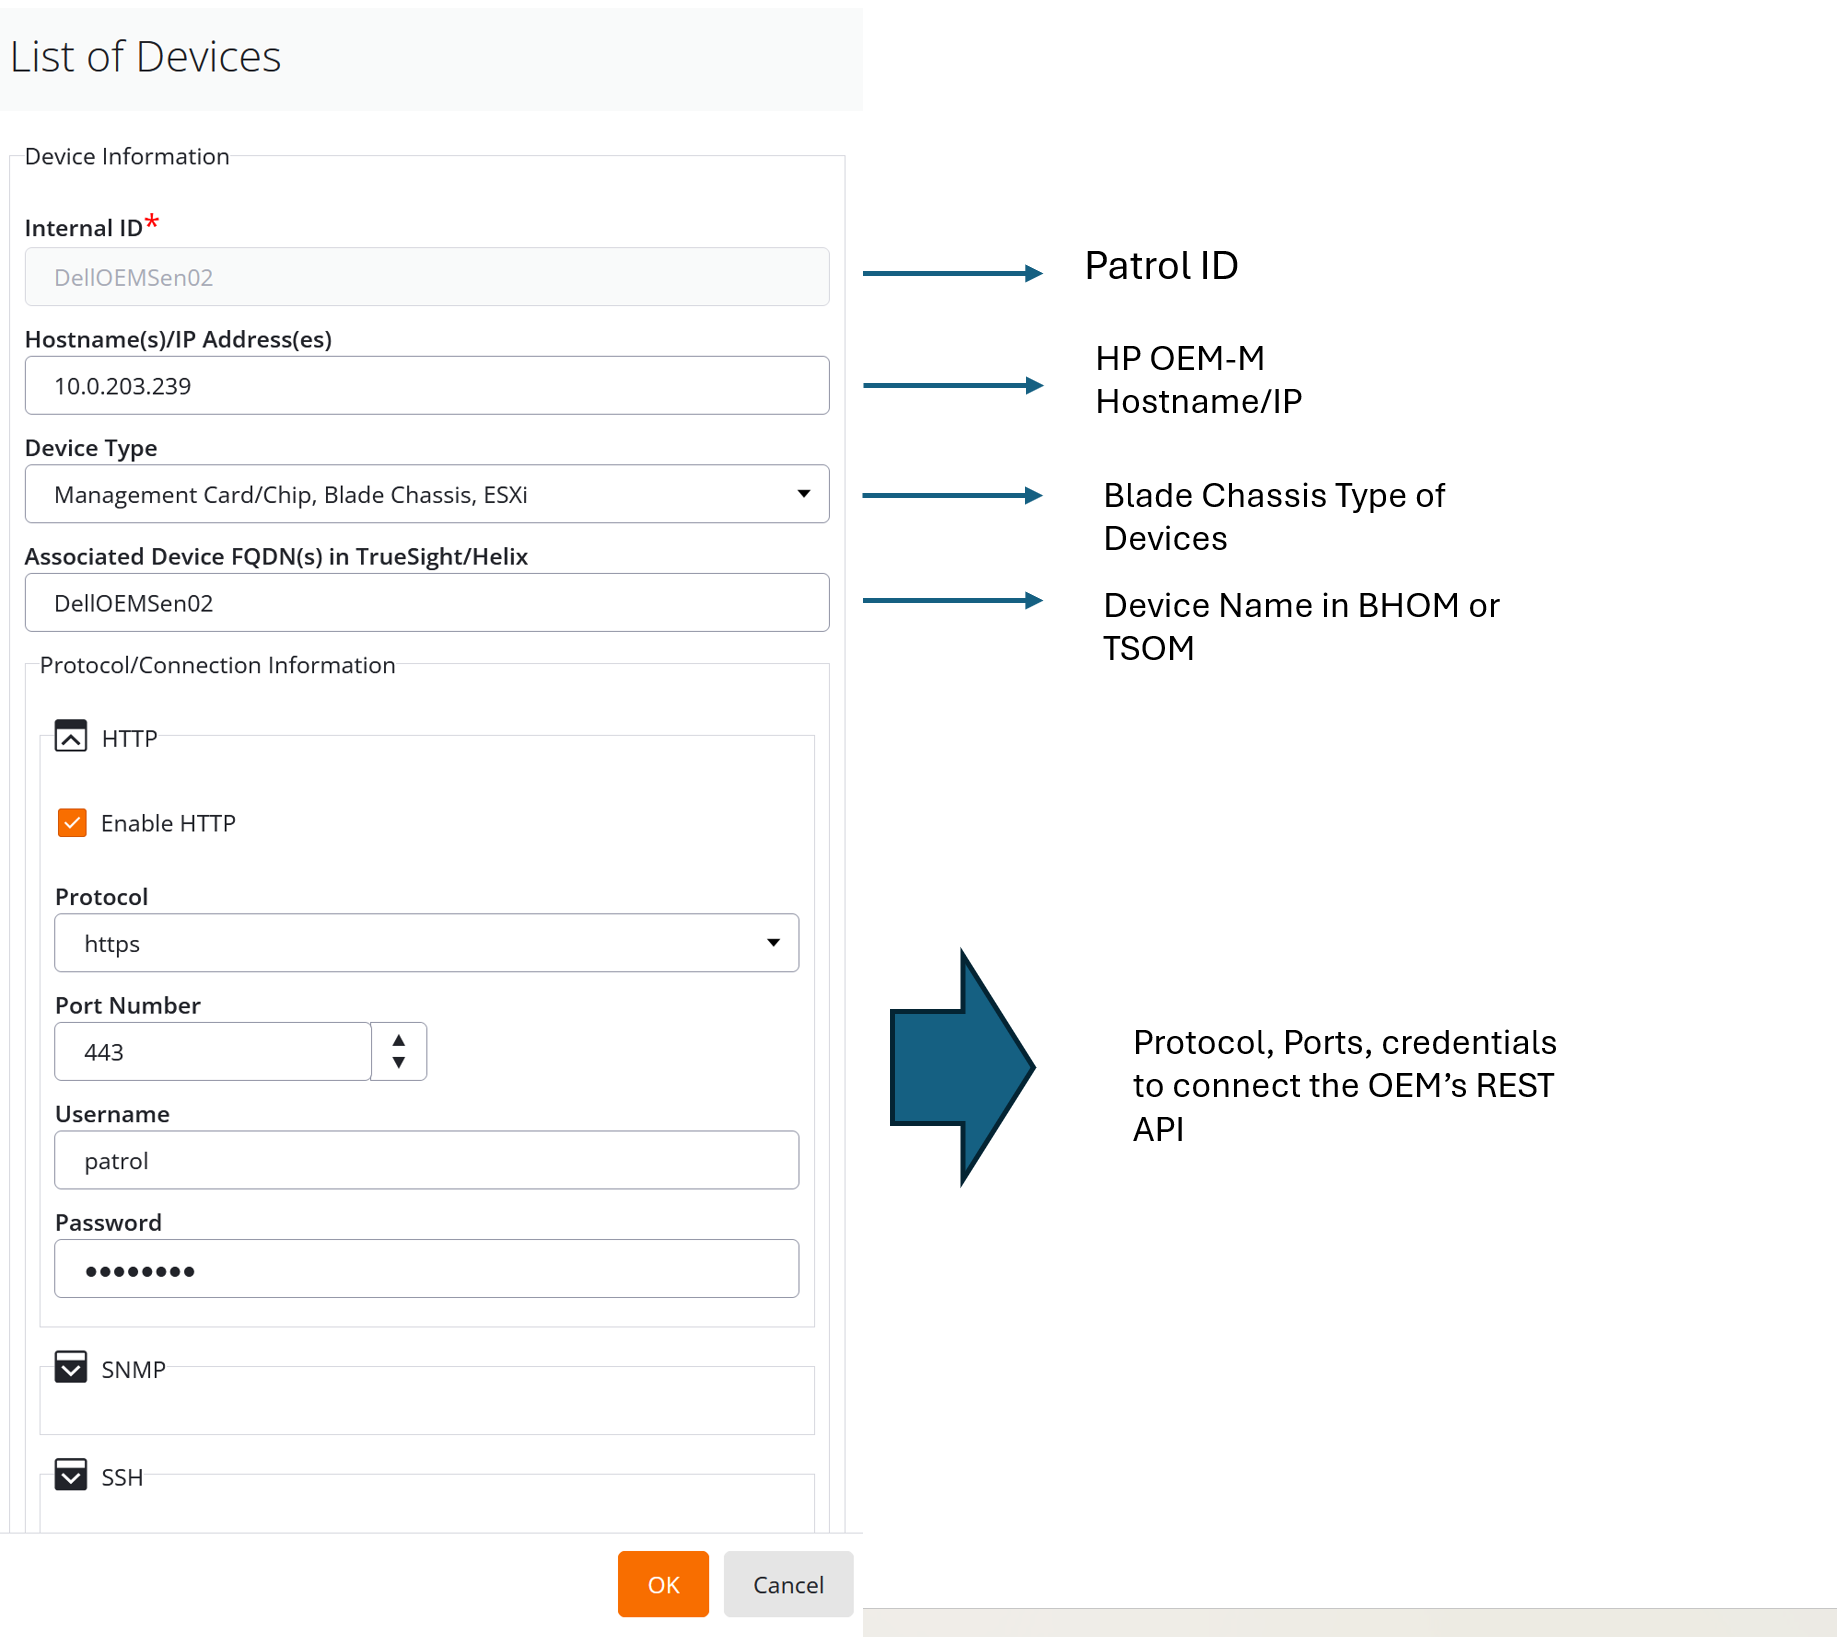
In the Hardware Configuration section, click Add to create a new Device, then provide the:
- Internal ID: A unique identifier for the device in the policy (avoid special characters)
- Hostname/IP Address(es): The hostname or IP address of the OpenManage Enterprise - Modular hostname
- Device Type: Select the appropriate type (e.g., Management Card/Chip, Blade Chassis, ESXi)
Using In-Band Monitoring (Agent-Based) with Dell OMSA
OMSA (OpenManage Server Administrator) is Dell’s in-band hardware management software that runs inside the operating system. It provides:
- Full hardware visibility (storage, RAID, power, thermal, sensors)
- Monitoring via SNMP, IPMI, or WBEM
OMSA is required for:
- PowerEdge 11G and earlier, where the iDRAC interface does not provide sufficient out-of-band monitoring capabilities.
- PowerEdge 12G servers when complete hardware coverage is needed.
Because OMSA runs inside the OS, monitoring is unavailable if the OS is down.
Using SNMP and OMSA Agent
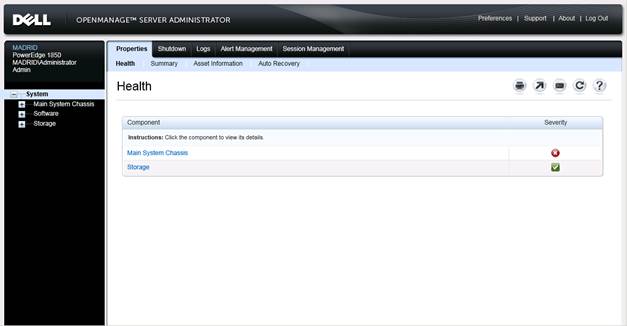
To monitor the old generation of Dell PowerEdge servers, you need to install Dell OpenManage Server Administrator (OMSA) on your Dell PowerEdge server. This hardware agent covers all hardware aspects of Dell PowerEdge servers: temperatures, fans, power supplies, controllers, physical disks, processors, memory modules, etc. A good way to check if Dell OMSA is properly installed and configured is to connect to its Web interface. Typically, the URL to connect to is ‹hostname>:1311/
Dell OpenManage Server Administrator can be downloaded from Dell’s Website.
Monitoring Prerequisites
- The Dell PowerEdge server runs Microsoft Windows or a supported distribution of Linux
- SNMP is running on the server (Windows SNMP service, or snmpd daemon on Linux). SNMP versions 1, 2c, and 3 (which needs a valid username/password) must be supported at least in read-only mode.
- SNMP is to be configured to allow requests from localhost with at least a community string enabled in read mode.
Installation procedure
On the Dell PowerEdge server to be monitored, install:
- the appropriate version of the Dell OpenManage Server Administrator agent (it depends on the operating system, its version and the processor architecture).
- the PATROL Agent
- Hardware Sentry KM v.10.2 or higher. Refer to Hardware Sentry User Guide for more details.
Configuration on Microsoft Windows systems
On Microsoft Windows systems, there is no specific configuration required for Hardware Sentry to discover and monitor the hardware of Dell PowerEdge servers.
Configuration on Linux systems
On Linux systems, the SNMP community configured in the snmpd daemon may not be “public”. In such a case, it is essential to verify that the SNMP community version selected to communicate with the SNMP agent installed on the monitored host is correct. Refer to Hardware Sentry User Guide for more details.
The monitoring of the network cards does not rely on Dell’s agent but on certain Linux command line utilities:
ifconfigethtoolmii-tool
Root privileges required
Both ethtool and mii-tool require root privileges. This means that Hardware Sentry KM needs to be configured to either execute commands as root or to use sudo for the ethtool and mii-tool programs. Sudo avoids the need to provide the KM with the password or the root account, but it requires the proper configuration of the /etc/sudoers file with your root account. The monitoring of the network cards will not work properly until the root account credentials are provided or the KM has been configured to use sudo.
Discovered Components and Monitored Parameters
Once the monitoring method and protocol are selected, Hardware Sentry KM automatically activates the appropriate connectors and collects hardware data accordingly.
The table below summarizes the monitoring approaches, the corresponding Hardware Sentry connectors, and the hardware information collected.
| Applicable Models / Platforms | Management Controller / iDRAC Version | Monitoring Method | Entry Point | Protocol | Hardware Connectors (Auto-Detected) | Hardware Information Collected |
|---|---|---|---|---|---|---|
|
PowerEdge Rack (R) and XC servers Generations 14G–17G |
iDRAC9 (14G–16G) iDRAC10 (17G) |
Out-of-Band (Agentless) | iDRAC management interface | HTTP/REST (Redfish) | Dell iDRAC REST | Server health, sensors, power, thermal, processors, memory, fans, power supplies |
|
PowerEdge Rack (R) and XC servers Generations 12G–17G |
iDRAC7 (12G) iDRAC8 (13G) iDRAC9 (14G–16G) iDRAC10 (17G) |
Out-of-Band (Agentless) | iDRAC management interface | SNMP |
Dell iDRAC SNMP – Server
Dell iDRAC SNMP – Storage |
Server health, sensors, power, thermal, RAID controllers, physical disks |
|
MX7000 chassis and MX Series compute sleds (MX750c, MX760c, MX770c) |
iDRAC9 / iDRAC10 (compute sleds) OME-M (chassis) |
Out-of-Band (Agentless) | MX7000 chassis (OME-M) | HTTP/REST | Dell MX Chassis and Blades (REST) |
|
|
PowerEdge M-Series blades in M1000e chassis |
iDRAC6 / iDRAC7 / iDRAC8 / iDRAC9 (blades) DRAC/MC (chassis) |
Out-of-Band (Agentless) | M1000e chassis | SNMP / SSH | Dell DRAC/MC (Modular Chassis) | Blade hardware, chassis power, cooling, shared infrastructure |
|
PowerEdge 11G and earlier PowerEdge 12G (when full hardware coverage is required) |
iDRAC6 / iDRAC7 OMSA (OS-based) |
In-Band (Agent-Based) | Operating system | SNMP / WBEM / IPMI |
Dell OpenManage Server Administrator
Dell Storage Manager Dell Array Manager WMI – Network or MIB-2 Standard SNMP Agent – Network Interfaces |
Full server hardware inventory and health (including storage, RAID, disks, network interfaces) |
Appendix
Monitoring Glossary
| Term | Description |
|---|---|
| Dell DRAC/MC (Dell Remote Access Controller / Modular Chassis) | Dell’s out-of-band chassis management controller for legacy blade platforms such as PowerEdge M1000e, providing centralized management and monitoring of blade servers and shared infrastructure. Protocol: SNMP. Note: Requires a remote host configuration. |
| Dell MX7000 Chassis | Modular enclosure hosting PowerEdge MX compute, storage, and fabric modules, providing shared power, cooling, and networking, centrally managed through OpenManage Enterprise – Modular (OME-M). |
| Dell PowerEdge M-Series Blades | Blade servers designed to operate inside the PowerEdge M1000e chassis, providing compute resources in a shared, high-density enclosure. Each blade includes its own iDRAC for server-level management. |
| Dell PowerEdge M1000e Chassis | Legacy blade server enclosure hosting M-Series blades, providing shared power, cooling, and networking, with chassis-level management via DRAC/MC (not iDRAC). |
| Dell PowerEdge MX Series | Modular compute sleds designed to operate inside the MX7000 chassis, providing scalable compute resources managed via iDRAC at the node level and OME-M at the chassis level. |
| Dell PowerEdge Rack Servers (R Series) | Standalone rack-mounted servers designed for general-purpose workloads, managed individually through iDRAC. |
| Dell PowerEdge XC Series | Hyperconverged infrastructure (HCI) systems based on PowerEdge hardware, integrating compute and storage in a single node. Hardware is managed through iDRAC, while cluster operations are handled by HCI software. |
| Hardware Connectors | Software integration components that connect to vendor hardware instrumentation layers to discover, collect, and normalize hardware health metrics. They bridge physical infrastructure and monitoring platforms by translating data exposed via standard management protocols (HTTP/REST, SNMP, WBEM, IPMI) into actionable metrics, events, and alerts. |
| iDRAC (Integrated Dell Remote Access Controller) | Dell’s embedded baseboard management controller (BMC) providing out-of-band access to PowerEdge servers. Enables remote hardware management and metrics collection independent of the OS, even when the OS is down or the server is powered off. Embedded in PowerEdge servers from 11G (2009) through 17G. Full out-of-band hardware monitoring is effectively supported starting with 12G / iDRAC7. Protocols: HTTP/REST (Redfish), SNMP. Note: Requires a remote host configuration. |
| In-Band / Agent-Based Monitoring | Hardware monitoring performed from within the operating system, using an OS-based agent such as OMSA. Requires the OS to be running and accessible. |
| OMSA (OpenManage Server Administrator) | Dell’s in-band hardware management software running inside the operating system, providing detailed hardware health information. Protocols: SNMP, IPMI, WBEM. Note: Supports both remote host and localhost configurations. |
| OpenManage Enterprise – Modular (OME-M) | Dell’s centralized out-of-band management platform for the MX7000 chassis and PowerEdge MX systems, providing chassis-level management and monitoring of compute, storage, and fabric components without requiring an OS. Protocol: HTTP/REST. Note: Requires a remote host configuration. |
| Out-of-Band (OOB) / Agentless Monitoring | Hardware monitoring performed independently of the operating system, using management controllers such as iDRAC, OME-M, or DRAC/MC, enabling monitoring even when the OS is unavailable. |
Related Topics
- How to Monitor Dell EMC PowerProtect DD Storage Systems with Storage Analyzer KM
- How to Monitor Dell EMC Unity Storage Systems with Storage Analyzer KM
- How to Monitor Dell EMC ScaleIO/PowerFlex Storage Systems with Storage Analyzer KM
- How to Monitor NetApp E-Series Storage Systems with Storage Analyzer KM
- How to Monitor NetApp FAS/AFF Filers with Storage Analyzer KM