Introduction
It might happen that some events, generated by a Sentry KM, are not reaching the TrueSight Infrastructure Management cell and therefore, are not present in the TrueSight Presentation Server. It may be caused by:
- A PATROL Agent-Cell communication issue
- A PATROL Agent/KM collection problem or bug
- A cell rule or propagation issue.
Because other reasons may exist, the Sentry Support Team recommends troubleshooting this issue as soon as it occurs as described below. If you wait too long, it will be impossible for the BMC/Sentry Support Team to determine the exact root cause(s).
Procedure
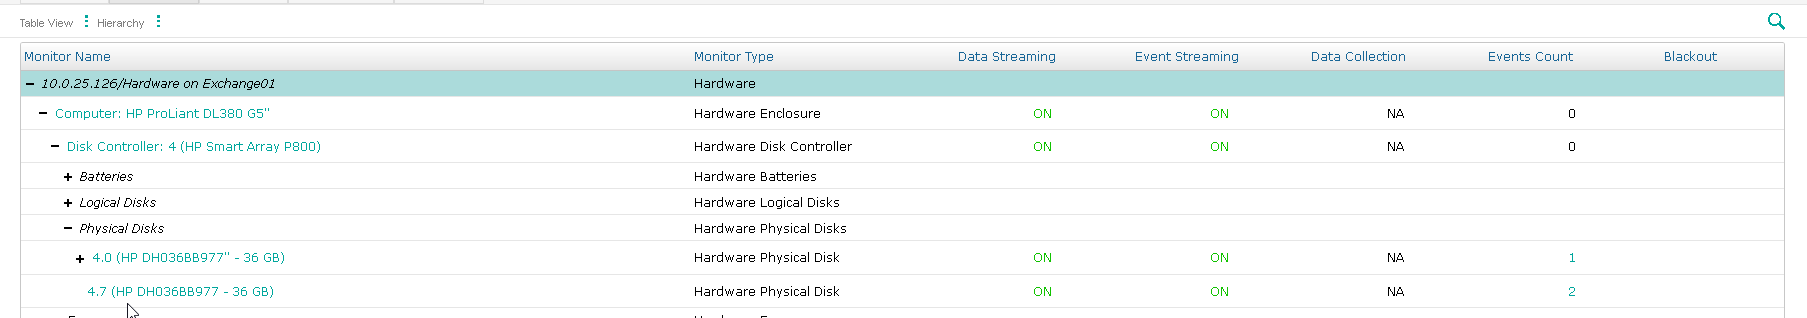
In the procedure described below, the monitored device for which we noticed missed events has Exchange01 as ID and 10.0.25.126 as IP address.
To troubleshoot the missed events:
-
Run the PATROL Agent’s dump_hist utility:
-
On Windows
print(system("dump_hist -class MS_HW_PHYSICALDISK -param Present -inst Exchange01 >%PATROL_HOME%\\PA_history.txt")); -
On Linux/UNIX
print(system("dump_hist -class MS_HW_PHYSICALDISK -param Present -inst Exchange01 >$PATROL_HOME/PA_history.txt"));The MS_HW_PHYSICALDISK Application Class and the Present Parameter can be replaced with any other hardware Application Class or Parameter.
-
-
Run the dump_events utility:
-
On Windows
print(system("dump_events -m \"%4$s %6$s %7$s\\n\" -d %PATROL_HOME%\\PA_events.txt")); -
On Linux/UNIX
print(system("dump_events -m \"%4$s %6$s %7$s\\n\" -d $PATROL_HOME/PA_events.txt"));
For more information, refer to the dump_hist and dump_events utilities documentation. -
-
Verify in the PA_history.txt file generated by the dump_hist utility that the PATROL Agent and the KM were collecting data and generating events within that timeframe. In our example, here is the result we obtained for the physical disk we are interested in:
 sam3/MS_HW_PHYSICALDISK.MS_HW_CpqDriveArrayNThdfExchange01_47/Present
                 Tue May 28 03:43:32 2019 1
                 Tue May 28 03:48:35 2019 1
                 Tue May 28 03:53:44 2019 1
                 Tue May 28 03:58:47 2019 1
 ...

                 Wed May 29 09:06:10 2019 1
                 Wed May 29 09:11:24 2019 1
                 Wed May 29 09:15:50 2019 1
                 Wed May 29 09:16:36 2019 0
 Total matched parameters: 2
We can see that the Present Parameter of the MS_HW_PHYSICALDISK Application Class of the Exchange01 device went from 1 (Present) to 0 (Missing) between two collects/discoveries.
-
When we check the PA_events.txt file generated by the dump_events utility, we can see that an event has been actually generated:
 Wed May 29 09:16:36 2019 MS_HW_PHYSICALDISK.MS_HW_CpqDriveArrayNThdfExchange01_47.Present Physical Disk problem on 10.0.25.126 (10.0.25.126) with 4.7 (HP DH036BB977 - 36 GB). This physical disk is not detected anymore.

 Hardware Health Report (Wed May 29 09:16:36 2019)
 ======================

 Monitored object   : 4.7 (HP DH036BB977 - 36 GB)
 Type               : Physical Disk
 On host            : Exchange01 (10.0.25.126)
 PATROL object ID   : /MS_HW_PHYSICALDISK/MS_HW_CpqDriveArrayNThdfExchange01_47
 Internal device ID : 4.7
 Connector used     : MS_HW_CpqDriveArrayNT.hdf
 Serial number          : 3PE09Y4E000098201A5L
 Size                   : 36 GB
 Identifying Information:
 - Port 3I Box 1 Bay 1

 This object is attached to:

 Disk Controller: 4 (HP Smart Array P800)
 Type: Disk Controller
 Serial
 Identifying Information:
 - Slot 5"

 Computer: HP ProLiant DL380 G5"
 Type: Enclosure
 Serial
 Identifying Information:
 - Product ID: AG815A"
 - Service

 Hardware on Exchange01

 ============================================================
 Parameter: Present (Currently in ALARM state)
 ------------------------------------------------------------
 Current value: 0 (Missing)
 Unit         : 0 = Missing ; 1 = Present
 Current state: ALARM

 Thresholds:
   - If Present value is 0 (Missing): Trigger an ALARM

 Problem: This physical disk is not detected anymore.

 Consequence: If part of a RAID subsystem, a missing disk will affect the overall
 performance, but filesystems should still be up and running. If not part of a
 RAID, the filesystems of this disk will no longer be available (data loss).

 Recommended action: Check if the physical disk is really missing. The
 non-detection may be due to a dead disk or an unplugged cable.
 ============================================================
 Parameter: PredictedFailure (Currently in OK state)
 ------------------------------------------------------------
 Current value: 0 (OK) (collected at 09:12)
 Unit         : 0 = OK, 1 = A Failure Is Predicted
 Current state: OK

 Thresholds:
   - If PredictedFailure value is 1 (Failure Is Predicted): Trigger a WARNING

 Problem: None.

 Consequence: None.

 Recommended action: None.
 ============================================================
 Parameter: Status (Currently in OK state)
 ------------------------------------------------------------
 Current value: 0 (OK) (collected at 09:12)
 Unit         : 0 = OK ; 1 = Degraded ; 2 = Failed
 Current state: OK

 Thresholds:
   - If Status value is 1 (Degraded): Trigger a WARNING
   - If Status value is 2 (Failed): Trigger an ALARM

 Problem: None.

 Consequence: None.

 Recommended action: None.
These results confirm that the PATROL Agent and the KM are working as expected since data was properly collected and an event was generated.
If the dump_hist and dump_events utilities had revealed that data was not properly collected and no event was generated during this timeframe, we would have:
-
Verified in the
PATROL_HOME\log\*.errsfiles that the PATROL Agent and the KM were up and collecting data -
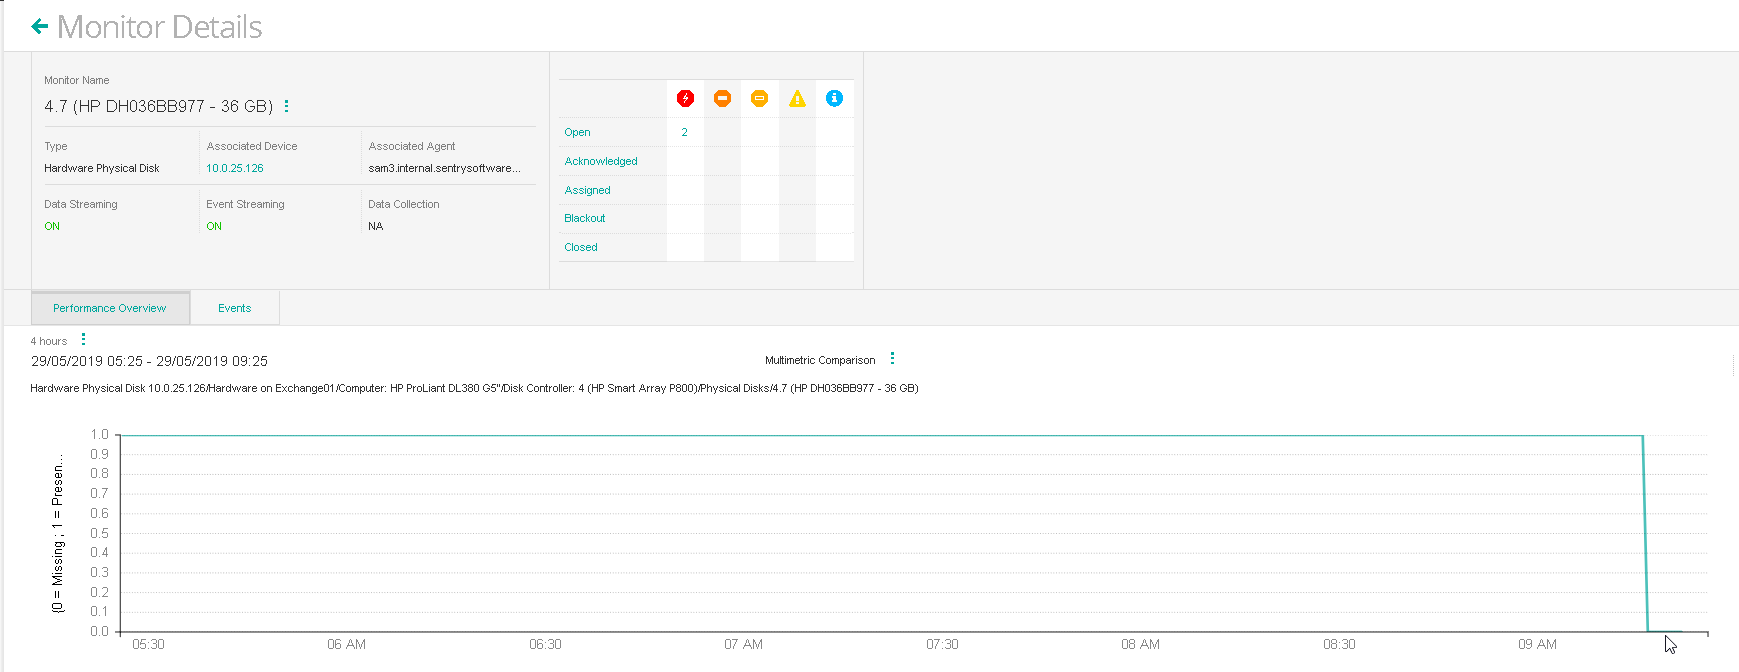
Verified in the TrueSight graph that data was collected for the same period:
-
Run the following command on the ISN cell the PATROL Agent is communicating with:
mquery -n <ISN_Cellname> -a PATROL_EV -w "mc_host_address: == 'Device_Address' AND mc_object_class: == 'MS_HW_PHYSICALDISK' AND mc_parameter: == 'Present' AND date: >= 20190529 " -s COUNTwhere <ISN_Cellname>, Device_Address, MS_HW_PHYSICALDISK, Present, and 20190529 should be replaced with the required values.
In our example, the command above returned a matching event.
-
Run the following command below to export the event in BAROC format:
mquery -n sup-tsps-11 -a PATROL_EV -w "mc_host_address: == '10.0.25.126' AND mc_object_class: == 'MS_HW_PHYSICALDISK' AND mc_parameter: == 'Present' AND date: >= 20190529 " -f BAROCRefer to the TrueSight documentation for more information about the mquery usage. -
Should you need further assistance from the BMC or Sentry Support Team, immediately take a copy of the following data from your ISN and TSIM servers:
 MCELL_HOME\etc\<cellname>\kb
 MCELL_HOME\var\<cellname>\mcdb and xact files
Related Topics
- How NetApp Filers KM for PATROL Reports 'Failed' and ‘Degraded' Status Values in the PATROL Console
- How to Manually Set Agent Thresholds in a CMA Policy
- Too Many Hardware Sentry Internal Events Generated in TrueSight/PATROL Consoles
- How to Generate Test PATROL_EV Events Using Monitoring Studio X
- Handling PATROL Events Generated by Sentry KMs in BMC Helix Operations Management