Description
When you encounter an issue with the Sentry’s monitoring solutions and wish to report it to Sentry Software, you will be asked to enable the Debug Mode and provide the debug output to the Support Team. This article explains how to enable debug.
Procedures for the Hardware Monitoring Solution
Depending on your version of Hardware Sentry and your BMC environment, the procedure will differ.
For TrueSight/BPPM Environments
When Using Hardware Sentry v1.9.60 and Older
- Configure the Monitor Settings.
- In the Global Advanced Settings section, click Debug.
-
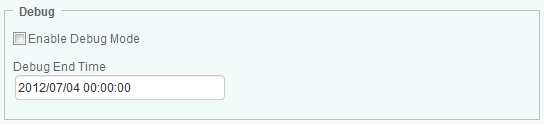
Check the Enable Debug Mode option. The solution will store debug information in a log file. By default debug files are stored in the
%PATROL_HOME%\logfolder -
In the Debug End Time field, enter the date and time at which the system must stop logging debug information. The required format is:
yyyy/mm/dd hh:mm:ssbased on a 24 hour-dayFor the debug mode to be enabled, the Enable Debug Mode must be checked and the Debug End Time must be properly set to a date and time in the future. -
Click Close to save your settings.
-
In the Add Monitor Types dialog box, click Add.
When Using Hardware Sentry v10.x.xx and Higher
The Debug mode must be enabled by running a query through the TrueSight built-in Agent Query Tool.
-
In the navigation pane of the TrueSight OM console, click Configuration and select Managed Devices.
-
Click a PATROL Agent
 menu and select Query PATROL Agent. The Agent Query Tool opens in a new browser window.
 -
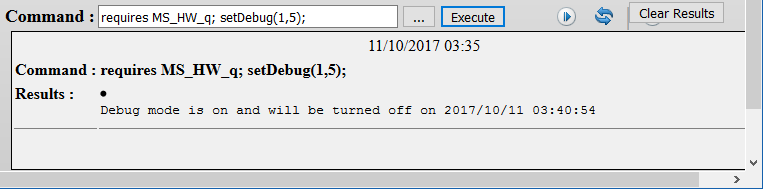
In the Command box, enter the MS_HW_q; setDebug command and click Execute.
Command
requires MS_HW_q; setDebug(mode, numberOfMinutes, listOfHosts);
This command allows you to enable/disable the debug mode at a specific time for all hosts or for a list of specific hosts. It requires the following arguments:
- mode: ‘1’ to turn on the debug mode (or “on”), ‘0’ to turn off the debug mode (or “off”). The debug mode is enabled or disabled on all the hosts associated to the PATROL Agent unless a host name or a list of host is provided.
- (Optional) numberOfMinutes: number of minutes the debug mode should be enabled. Default: 60
- (Optional) listOfHosts: PATROL ID of a host or a list of comma-separated hosts for which you specifically wish to enable the debug mode. Hardware Sentry creates the debugHostList configuration variable that is saved under
/SENTRY/HARDWARE. This configuration variable is automatically deleted when the debug mode is turned off (0).
Host IDs can be obtained by running the "requires MS_HW_q; hostsInfo();" query.
Examples
| To | Execute the following command |
|---|---|
| Enable the debug mode for all hosts (for 20 minutes) | requires MS_HW_q; setDebug(1, 20); |
| Enable the debug mode for specific hosts (for 20 minutes) | requires MS_HW_q; setDebug(1, 20, "HostID_1, HostID_2, HostID_3"); |
| Disable the debug mode for all the hosts (with immediate effect) | requires MS_HW_q; setDebug(0); |
The solution stores debug information in log files. By default, debug files (MS_HW_*.log) are stored in the %PATROL_HOME%\log or $PATROL_HOME/log folder.
For PATROL Classic Environments
To enable debug:
-
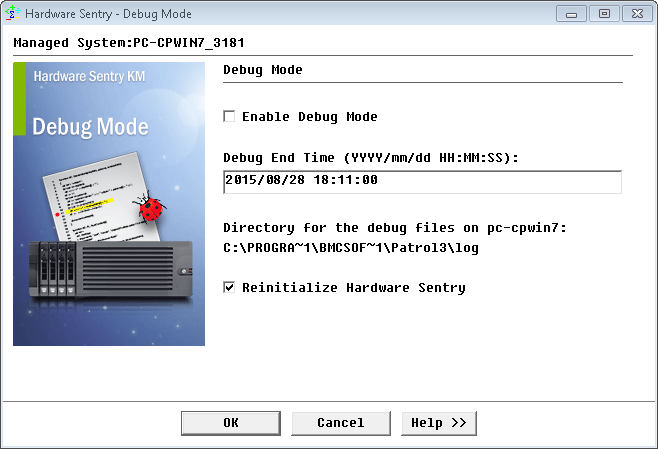
Right-click the main KM icon > KM Commands > KM Settings > Debug…
-
Check the Enable Debug Mode option.
-
Indicate the time when the debug mode will be disabled. The required format is:
yyyy/mm/dd hh:mm:ss, based on a 24 hour-day. By default, the debug mode is set to stop automatically after one hour. -
Check the Reinitialize Hardware Sentry option (optional).
-
Click OK. The debug files will automatically be saved in
$PATROL_HOME/log.
Procedures for the Storage Monitoring Solutions
For TrueSight/BPPM Environments
-
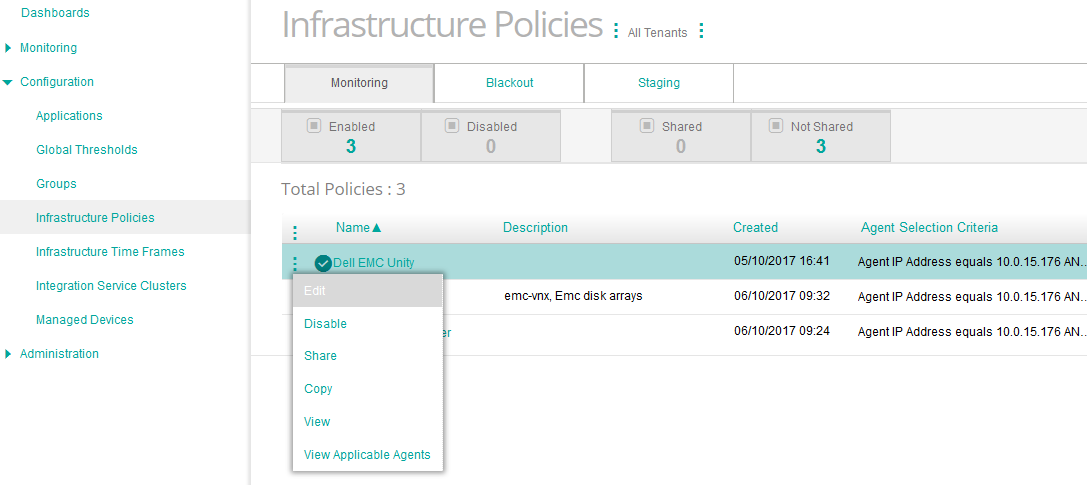
Edit your storage monitoring policy (in our example, Dell EMC Unity):
- Log on to the TrueSight console.
- In the navigation pane, expand Configuration and select Infrastructure Policies.
- In the Infrastructure Policies page, locate the monitoring policy you wish to modify, click its action button and click Edit.
- In the Edit Monitoring Policy page, locate the Storage Configuration you wish to modify and click its action button to access the monitoring options panel.
-
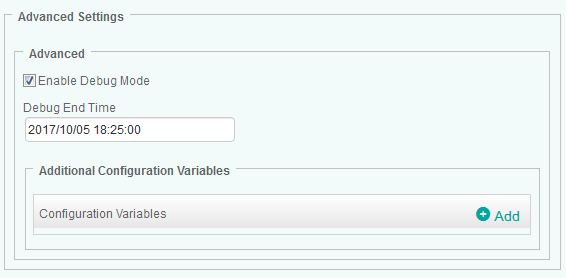
Locate the Advanced Settings section
-
Select the Enable Debug Mode option. The solution will store debug information in a log file. By default, debug files are stored in the
%PATROL_HOME%\logfolder. -
In the Debug End Time field, enter the date and time at which the system must stop logging debug information. Required format:
yyyy/mm/dd hh:mm:ss. -
Click OK
-
Click Save.
For PATROL Classic Environments
To enable the debug mode:
- Right-click the KM main icon > KM Commands > KM Settings > Debug…
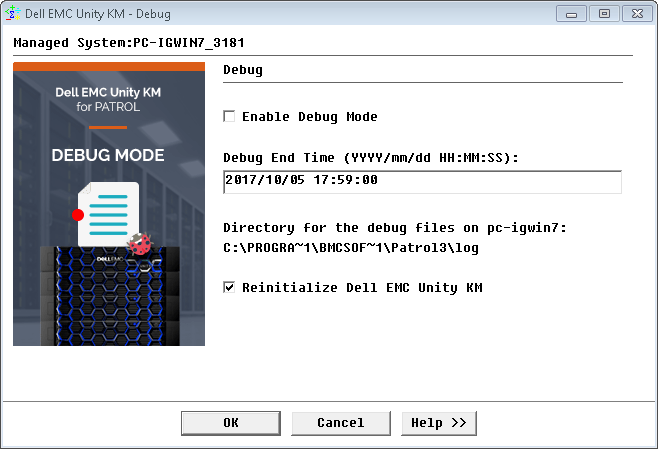
- Check the Enable Debug Mode option
- Indicate the date and time at which the system must stop logging debug information. The required format is:
YYYY/mm/dd HH:MM:SS - Check the Reinitialize KM option (optional).
- Click OK. The debug files will automatically be saved in
$PATROL_HOME/log
Procedures for the Backup Monitoring Solutions
For TrueSight/BPPM Environments
- Edit your monitoring policy
- Click the action button of the system for which you wish to enable the Debug Mode and click Edit
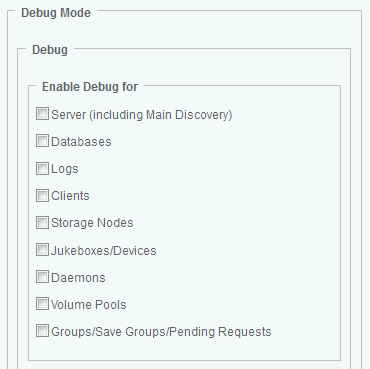
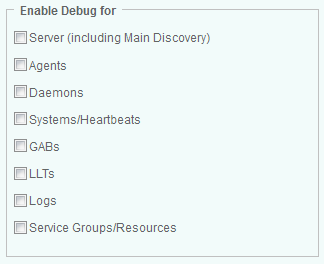
- In the Monitoring Settings panel, scroll down to the Debug section
- Select all the elements for which you want to obtain debug information
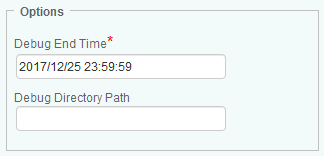
- In the Options section, indicate:
- when the system must stop logging debug information. The required format is:
YYYY/MM/DD HH:MM:SS - where the debug file will be stored. The default path is:
<PATROL_HOME>/lib/<ProductCode>/debug
- Click OK twice
- Click Save.
When the debug end time is reached, a tar/zip file is automatically created under <PATROL_HOME>/lib/<ProductCode>/ and can be sent to the Support Team for help. It is also recommended to check the <ProductCode>_<port>.log file, where <port> is the PATROL Agent port number, for any error. This file is stored in <PATROL_HOME>/log.
For PATROL Classic Environments
- In the PATROL Console, right-click the System instance > KM Commands > Configuration > Debug.
- Select On for the debug switch(es) you want to enable
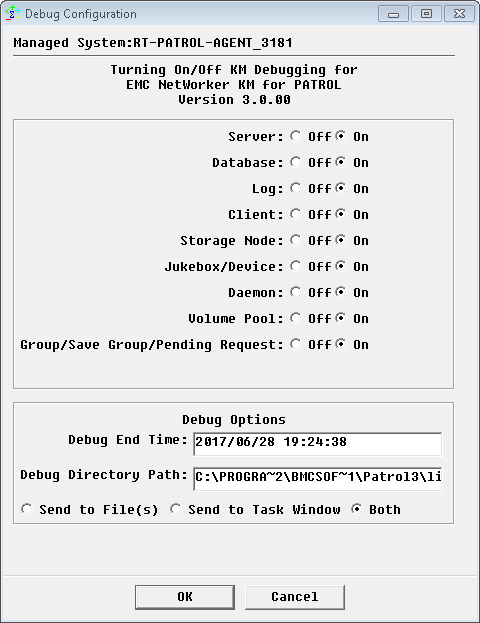
- Set the Debug Options:
- In the Debug End Time field, indicate the date and time after which debug information will no longer be logged.
- In the Debug Path field, indicate where the debug file will be stored (by default:
<PATROL_HOME>/lib/<ProductCode>/debugon UNIX systems;%PATROL_HOME%\lib\<ProductCode>/\debugon Microsoft Windows systems). The debug folder must have at least 10MB of available disk space and read, write and execute permissions for both PATROL Agent user and the KM login user. - Select Send to File(s) to write all debug messages in a file or set of files.
- Select Send to Task Window to view the debug messages as they occur in the Debug Output window. Before selecting this option, make sure the PATROL Console is connected to the PATROL Agent.
- Select Both (Recommended) to send the debug messages both to a file and task window.
- Click OK first to start the KM debugging
- Click Yes to reload KM and capture debug from the initial collection cycle.
When the debug end time is reached, a tar/zip file is automatically created under <PATROL_HOME>/lib/<ProductCode>/ and can be sent to the Support Team for help. It is also recommended to check the <ProductCode>_<port>.log file, where <port> is the PATROL Agent port number, for any error. This file is stored in <PATROL_HOME>/log.
Procedures for the High-Availability Monitoring Solutions
For TrueSight/BPPM Environments
- Edit your monitoring policy
- Click the action button of the system for which you wish to enable the Debug Mode and click Edit
- In the Monitoring Settings panel, scroll down to the Debug section
- Select all the elements for which you want to obtain debug information
- In the Options section, indicate:
-
when the system must stop logging debug information. The required format is:
YYYY/MM/DD HH:MM:SS -
where the debug file will be stored. The default path is:
<PATROL_HOME>/lib/<ProductCode>/debug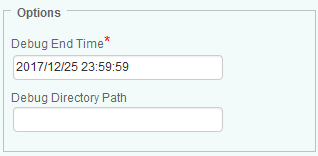
- Click OK twice
- Click Save.
When the debug end time is reached, a tar/zip file is automatically created under <PATROL_HOME>/lib/<ProductCode>/ and can be sent to the Support Team for help. It is also recommended to check the <ProductCode>_<port>.log file, where <port> is the PATROL Agent port number, for any error. This file is stored in <PATROL_HOME>/log.
For PATROL Classic Environments
- In the PATROL Console, right-click the System instance > KM Commands > Configuration > Debug.
- Select On for the debug switch(es) you want to enable
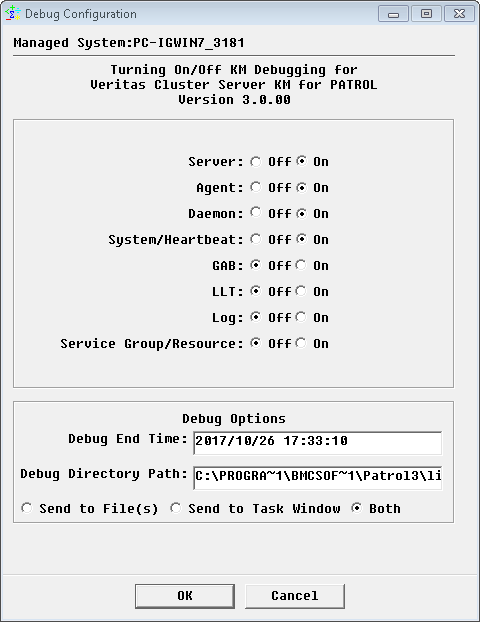
- Set the Debug Options:
- In the Debug End Time field, indicate the date and time after which debug information will no longer be logged.
- In the Debug Path field, indicate where the debug file will be stored (by default:
<PATROL_HOME>/lib/<ProductCode>/debugon UNIX systems;%PATROL_HOME%\lib\<ProductCode>\debugon Microsoft Windows systems). The debug folder must have at least 10MB of available disk space and read, write and execute permissions for both PATROL Agent user and the KM login user. - Select Send to File(s) to write all debug messages in a file or set of files.
- Select Send to Task Window to view the debug messages as they occur in the Debug Output window. Before selecting this option, make sure the PATROL Console is connected to the PATROL Agent.
- Select Both (Recommended) to send the debug messages both to a file and task window.
- Click OK first to start the KM debugging
- Click Yes to reload KM and capture debug from the initial collection cycle.
When the debug end time is reached, a tar/zip file is automatically created under <PATROL_HOME>/lib/<ProductCode>/ and can be sent to the Support Team for help. It is also recommended to check the <ProductCode>_<port>.log file, where <port> is the PATROL Agent port number, for any error. This file is stored in <PATROL_HOME>/log.