Principle
The Cisco UCS B-Series infrastructure consists of:
- A main chassis (UCS 5100) with the blade servers (B-Series)
- A couple of Fabric Interconnect Switches.
The switches are responsible for linking the blade servers to the LAN and to a SAN (optional). The switch is capable of handling all traffic on the same backplane (everything is 10 Gb/s Ethernet, and SAN traffic is encapsulated into Ethernet frames).
The switch is also responsible for the management of the entire platform. UCS Manager, the Cisco built-in administration tool, is actually a Web application running on the switch itself. It gives visibility on the health of the main chassis (temperature, cooling, powering), the health of the interconnect switches (temperature, cooling, powering, connectivity) and an overall status of each blade server.
In order to cover the entire UCS B-Series platform, Hardware Sentry KM connects to the switch to gather all metrics related to the main chassis and the switch.
Prerequisites
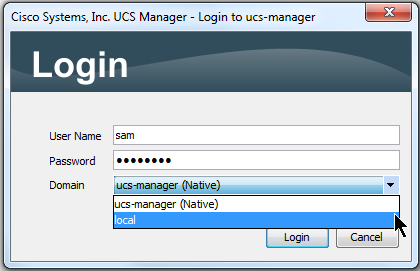
A user account with operator privileges is required to connect to the UCS Manager.
To validate your credentials:
-
Connect to the Cisco UCS Manager from the server on which the PATROL Agent is running.
-
Enter the credentials that you will also use to configure the monitoring of your Cisco UCS.
Connectors
Hardware Sentry KM uses Connector files to communicate with monitored systems. There are three different connectors for Cisco UCS Blade systems, all of which use different protocols.
All three rely on UCS Manager. There are some small differences in the monitors between connectors.
-
The REST API based connector will provide monitoring of the switch, but only provides an overall status of the blades.
-
The SNMP connector cannot provide switch monitoring, but it can provide more detailed blade monitoring, including Disk Controllers, memory and processors.
The REST API connector is recommended, so these instructions will use it. If you choose to use one of the others, simply select that protocol instead, and specify the appropriate connector.
Monitoring from TrueSight or Helix console
-
In the console, Add or edit a Monitoring Policy.
-
In the Add Monitoring Configuration section, choose the Hardware Sentry solution, and click Add in the list of devices. Specify the monitoring policy properties:
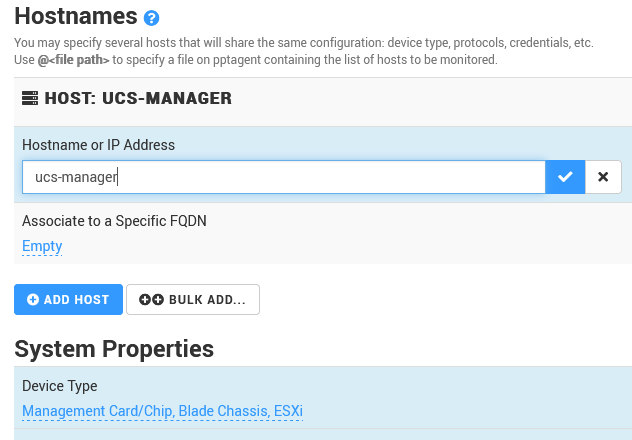
- Enter the Internal ID of the Cisco UCS you wish to monitor (ucs-manager in our example). This ID will be used as a label to identify the device in the TrueSight console.
- Enter the actual hostname or IP address of the Cisco UCS (ucs-manager in our example).
- From the Device Type list, select “Management Card/Chip, Blade Chassis, ESXi”.
- (Optional) Enter the FQDN to associate the system to another device in TrueSight. The FQDN uniquely distinguishes a device from any other system and ensures that a device monitored via their management cards or through controllers, for example, is properly identified.
-
Scroll down to the Protocol/Connection Information section.
-
Expand the HTTP section, And check the box to enable HTTP.
-
Enter the same credentials as used above to establish the connection to the UCS Manager’s URL.
-
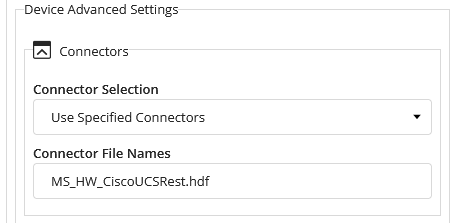
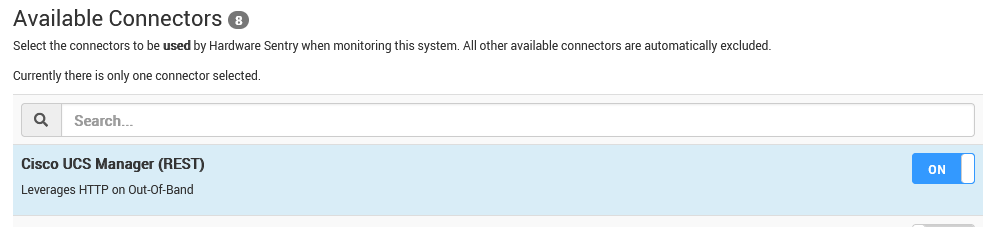
Scroll down to the Device Advanced Settings section and expand the Connectors panel.
-
From the Connector Selection list, select “Use Specified Connectors”.
-
In the Connector File Names, enter the name of the connector you wish to use, that is MS_HW_CiscoUCSRest.hdf for Cisco UCS.
-
Click OK twice to save your settings.
-
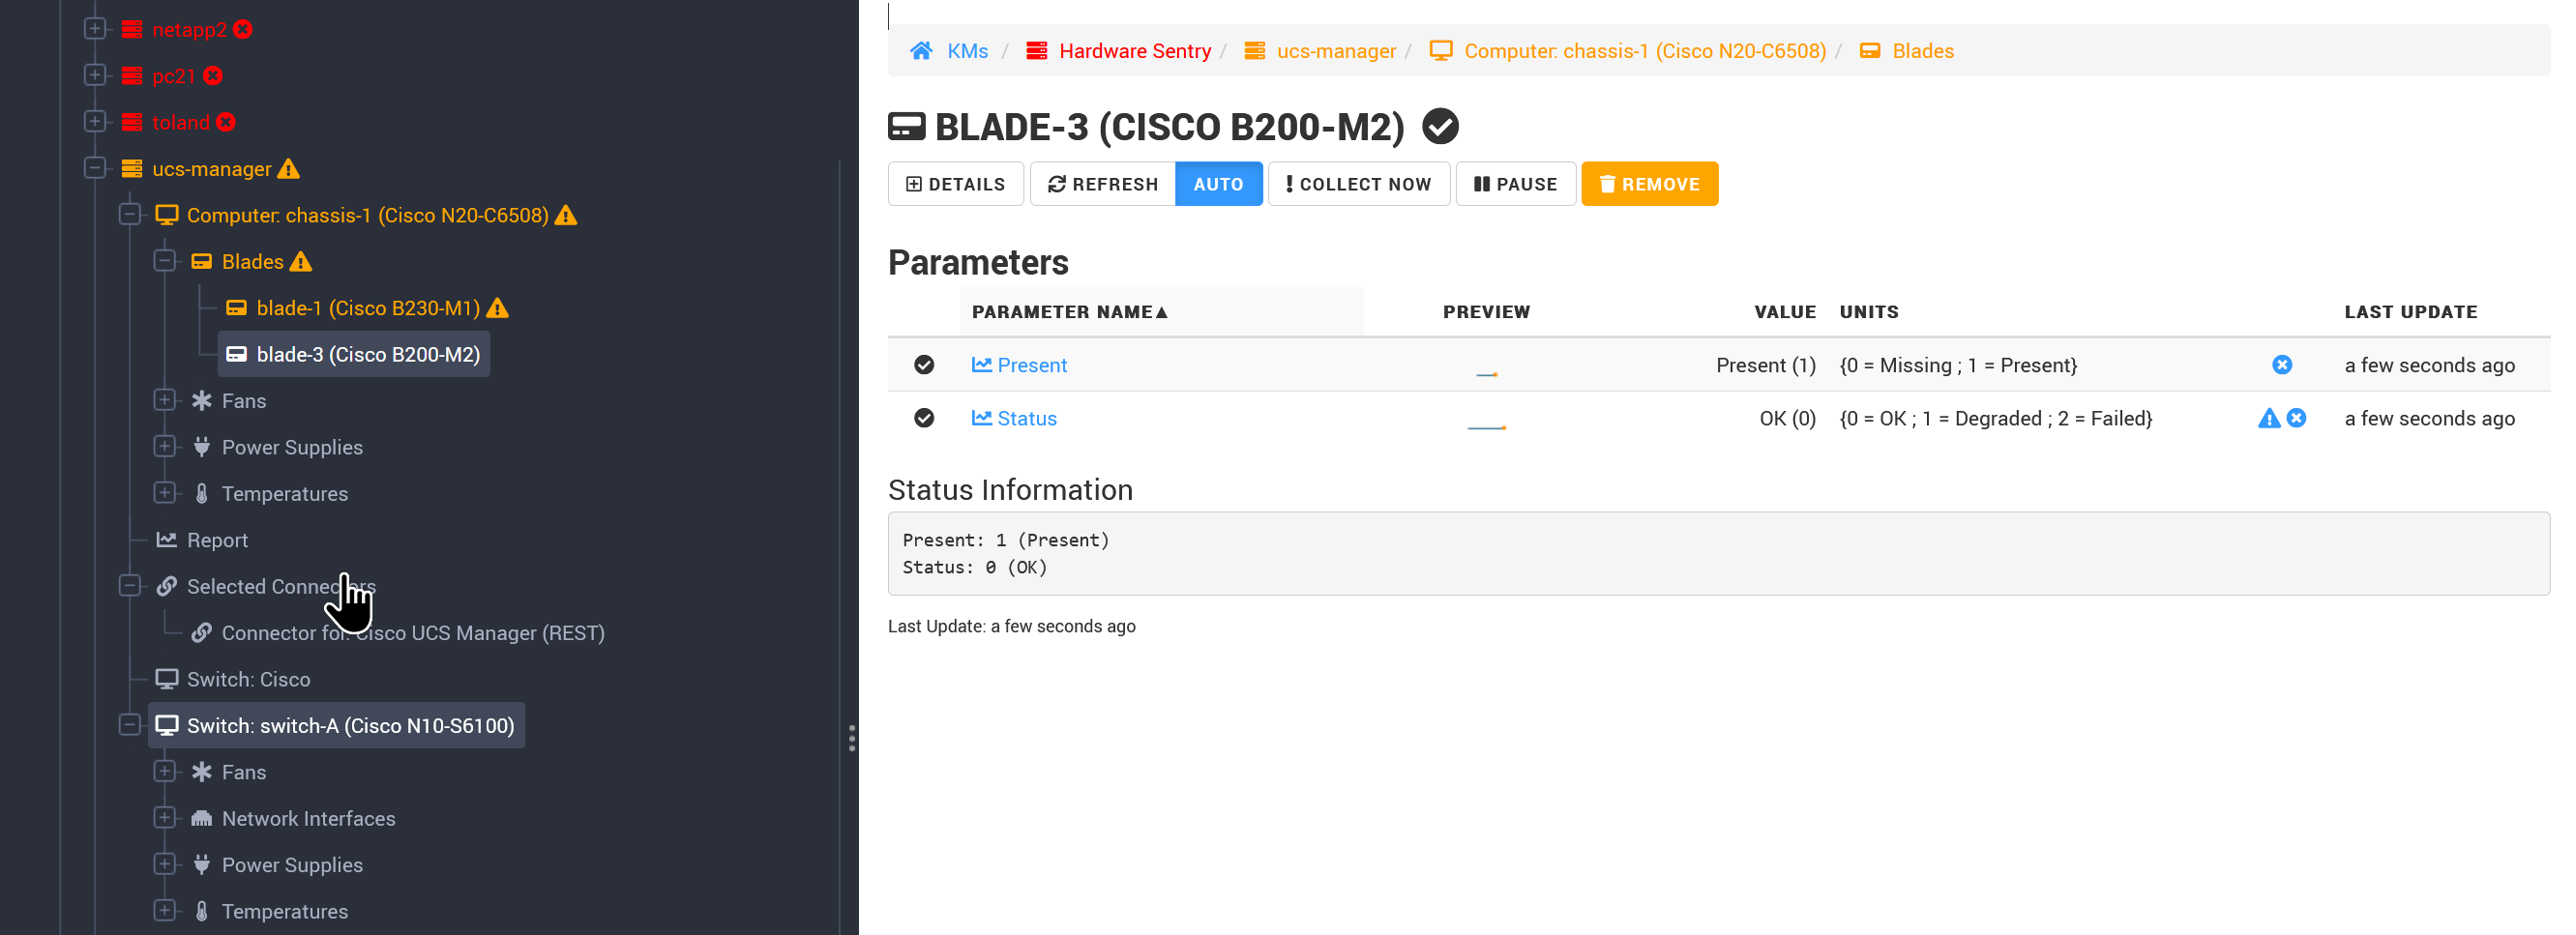
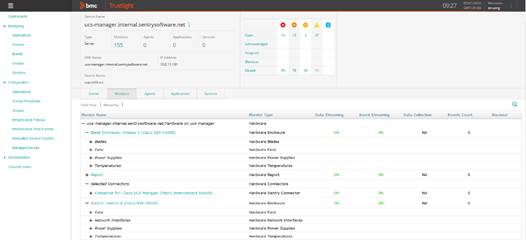
After a few minutes, the newly discovered devices is displayed in the Devices view:
Monitoring from the Monitoring Studio X console
-
Open the Monitoring Studio X console on your PATROL agent host at
https://<patrol-agent>:<patrol-agent-port+262>/ -
Navigate to KMs > Hardware Sentry.
-
Under Monitored Systems, click New System.
- Enter the hostname or IP address of the Cisco UCS.
- From the Device Type list, select “Management Card/Chip, Blade Chassis, ESXi”.
-
In the Protocols section, click the slider to enable HTTP.
-
Enter valid credentials for the UCS Manager.
-
In the Connector Selection section, select “Use the Connectors Specified Below”.
-
Under Available Connectors, search for Cisco UCS Manager (REST), and click the slider to enable it.
-
Click Create to save your settings.
-
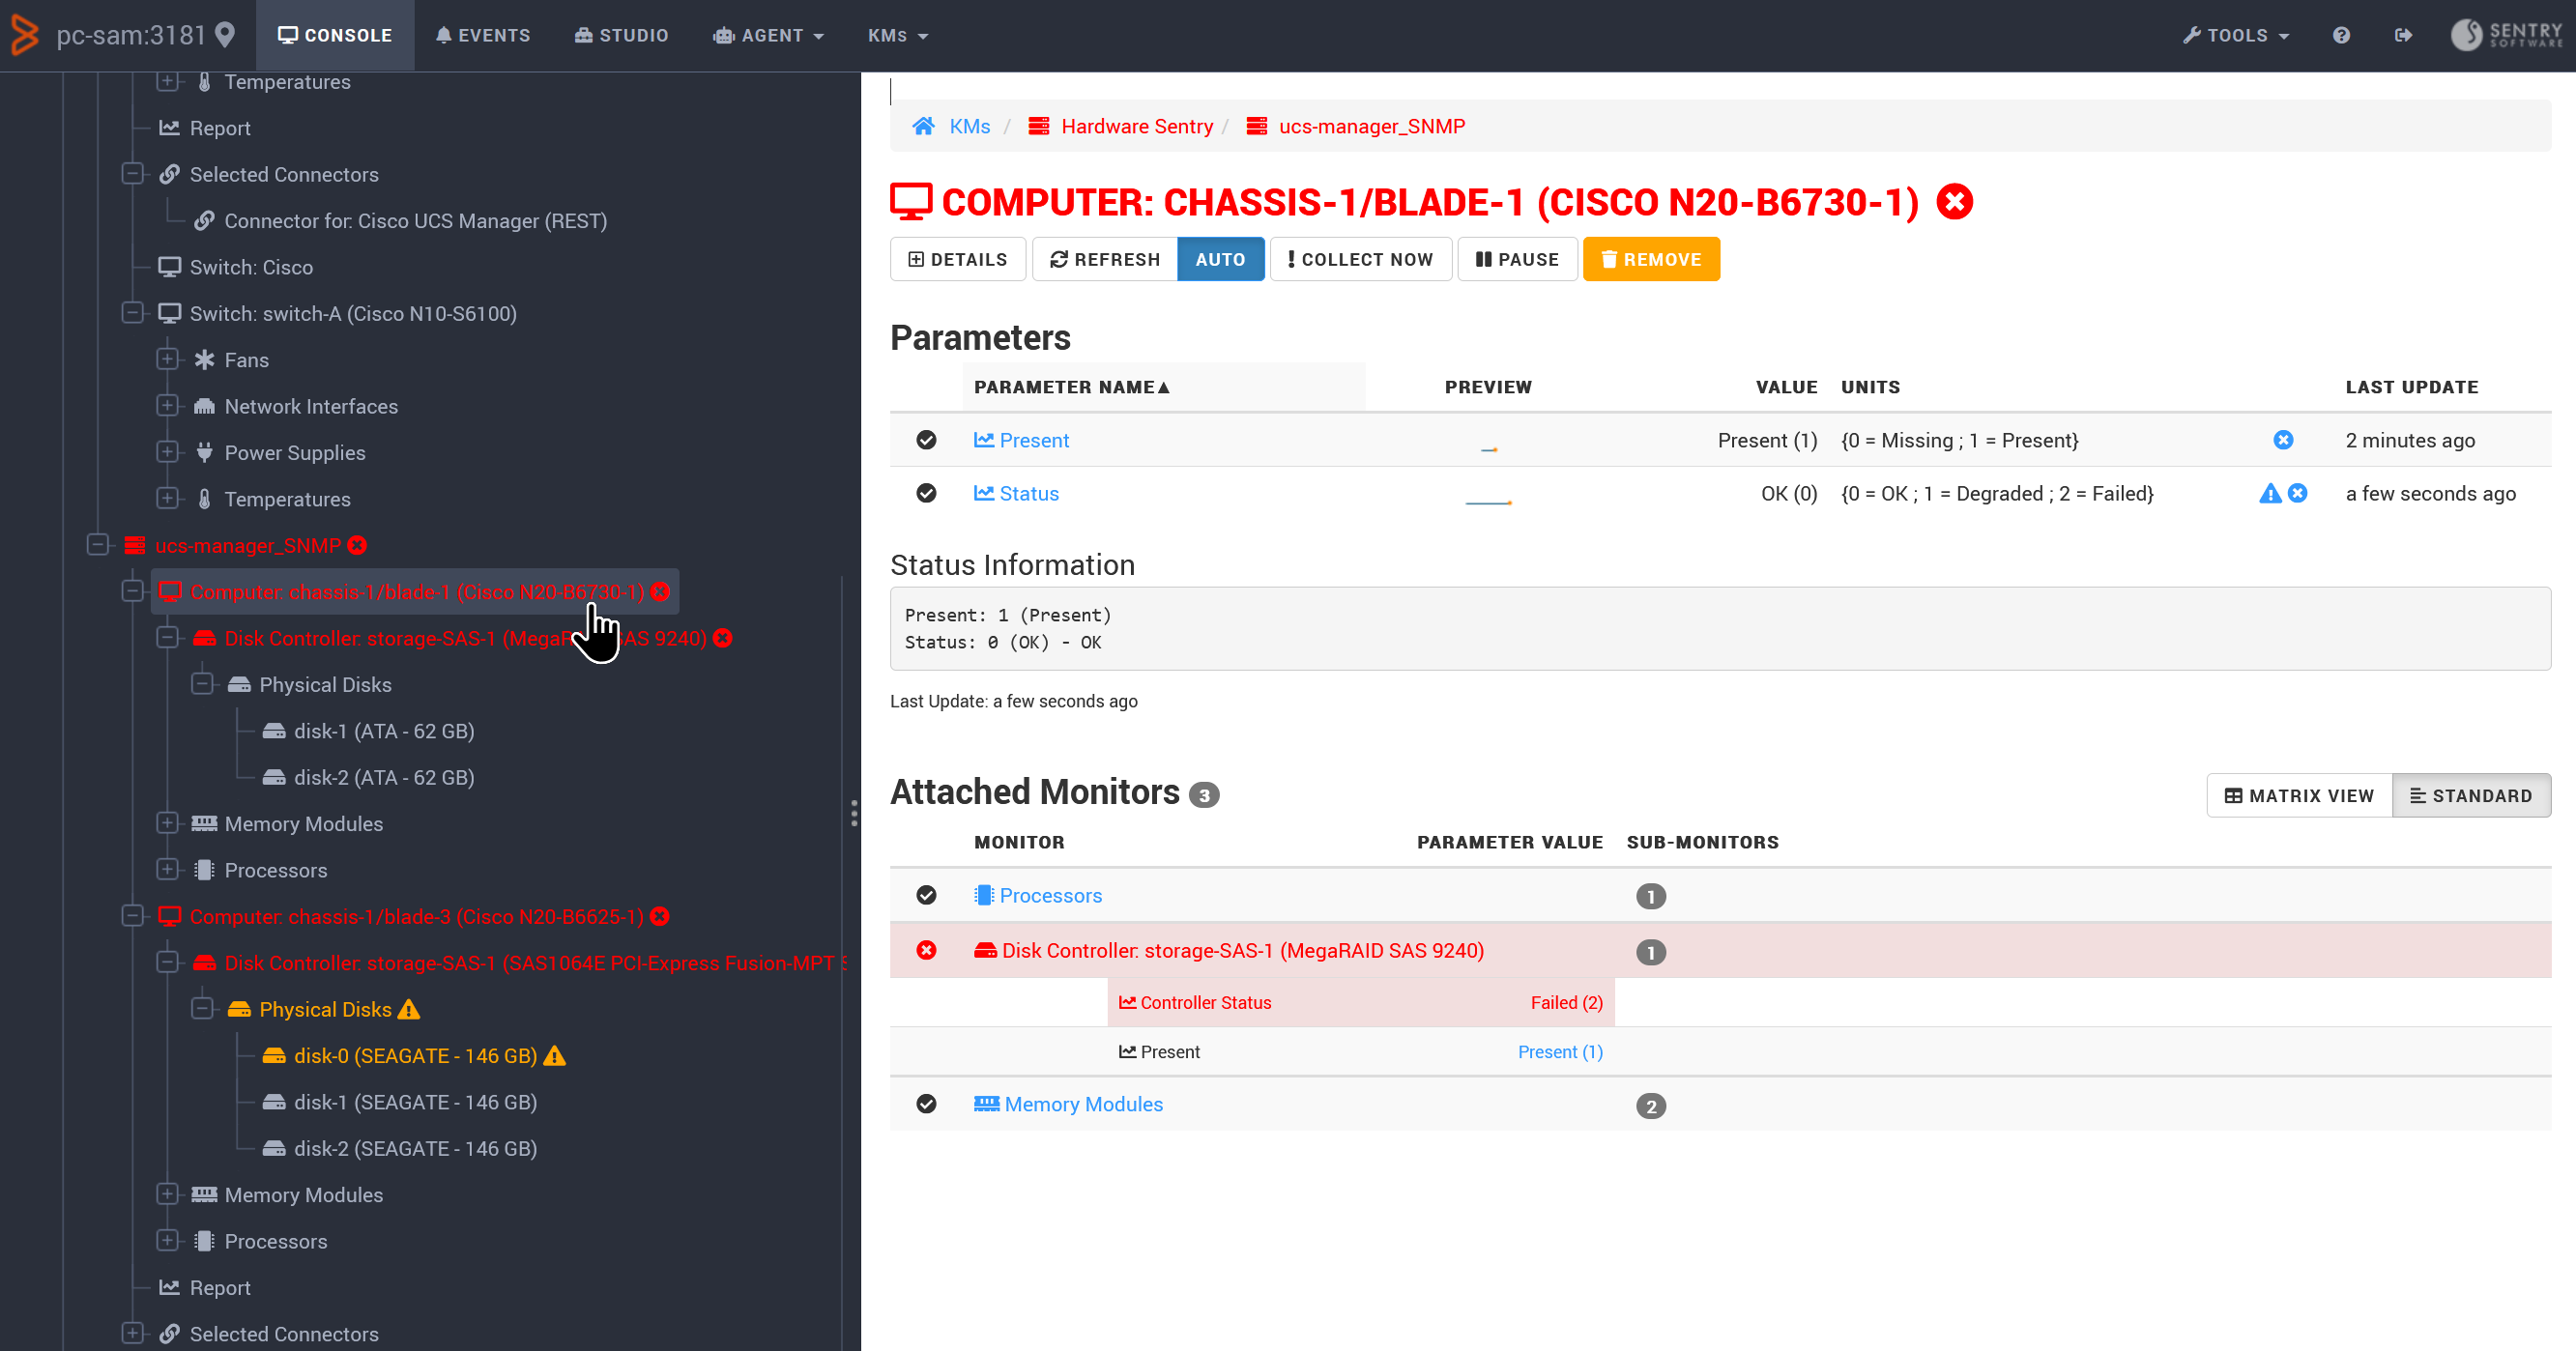
After a few minutes, the newly discovered device is displayed in the Console tab:
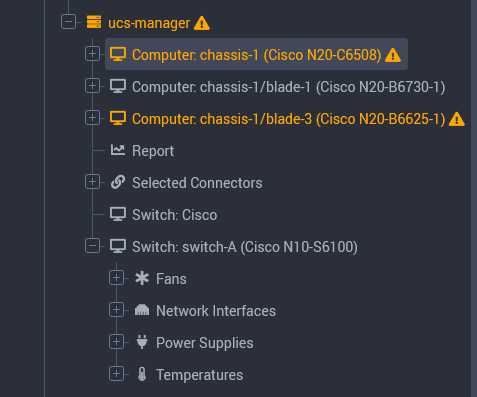
Monitoring Individual Blades
After monitoring of the blade enclosure has been configured, if more detailed monitoring information for the individual blades is required, they can be monitored individually as if they were standalone systems.
- For blades running ESXi, use the ESXi connectors
- For others, use generic connectors such as IPMI