Introduction
Only the Execution Time and HTTP Status Code parameters are displayed for the HTTP Request Monitors
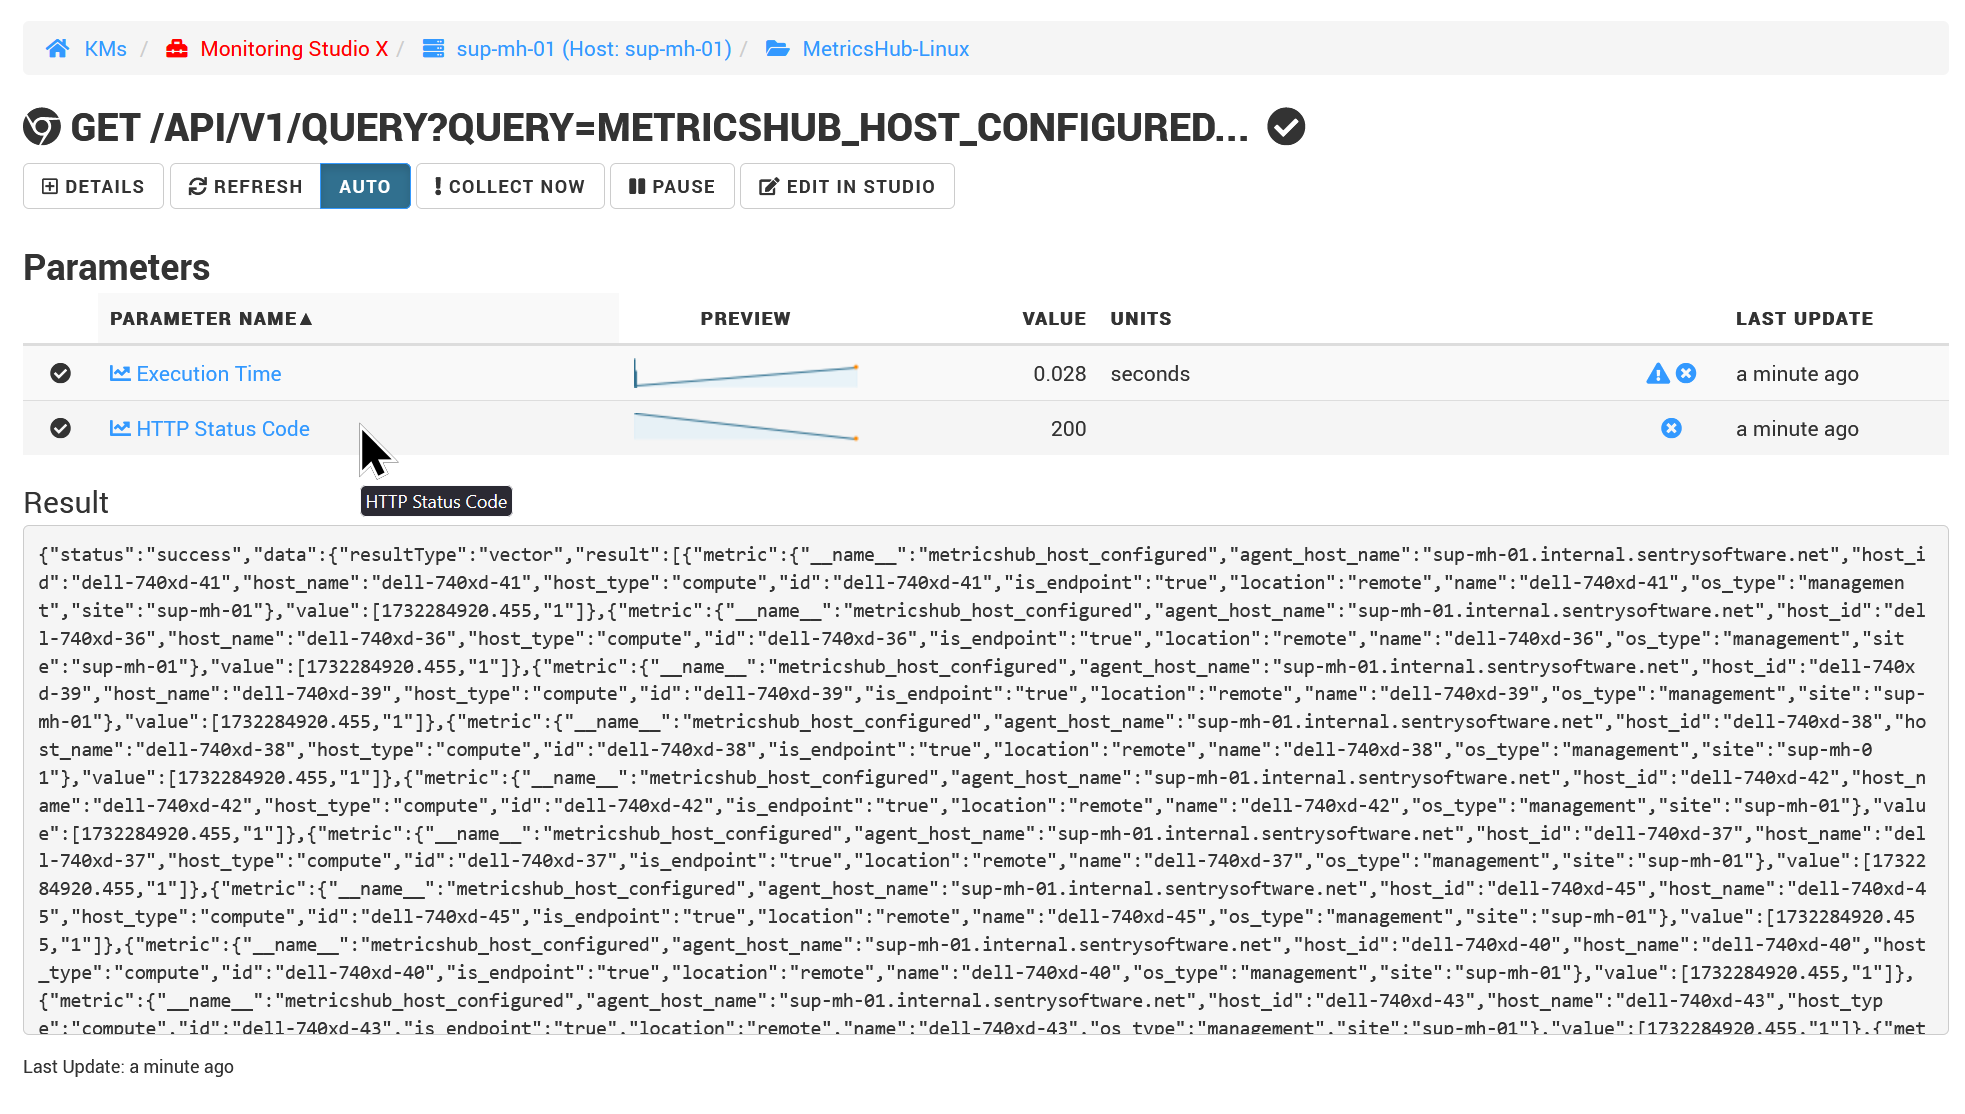
This article explains how to enable the HTTP Status parameter should you need it.
Procedure
-
Open the Monitoring Studio X console, which is available at
https://\<PATROL_Agent_Hostname\>:\<port\>where\<port\>equals PATROL Agent’s port+ 262. For instance, if the PATROL Agent runs on 3181 then\<port\>will be 3443. -
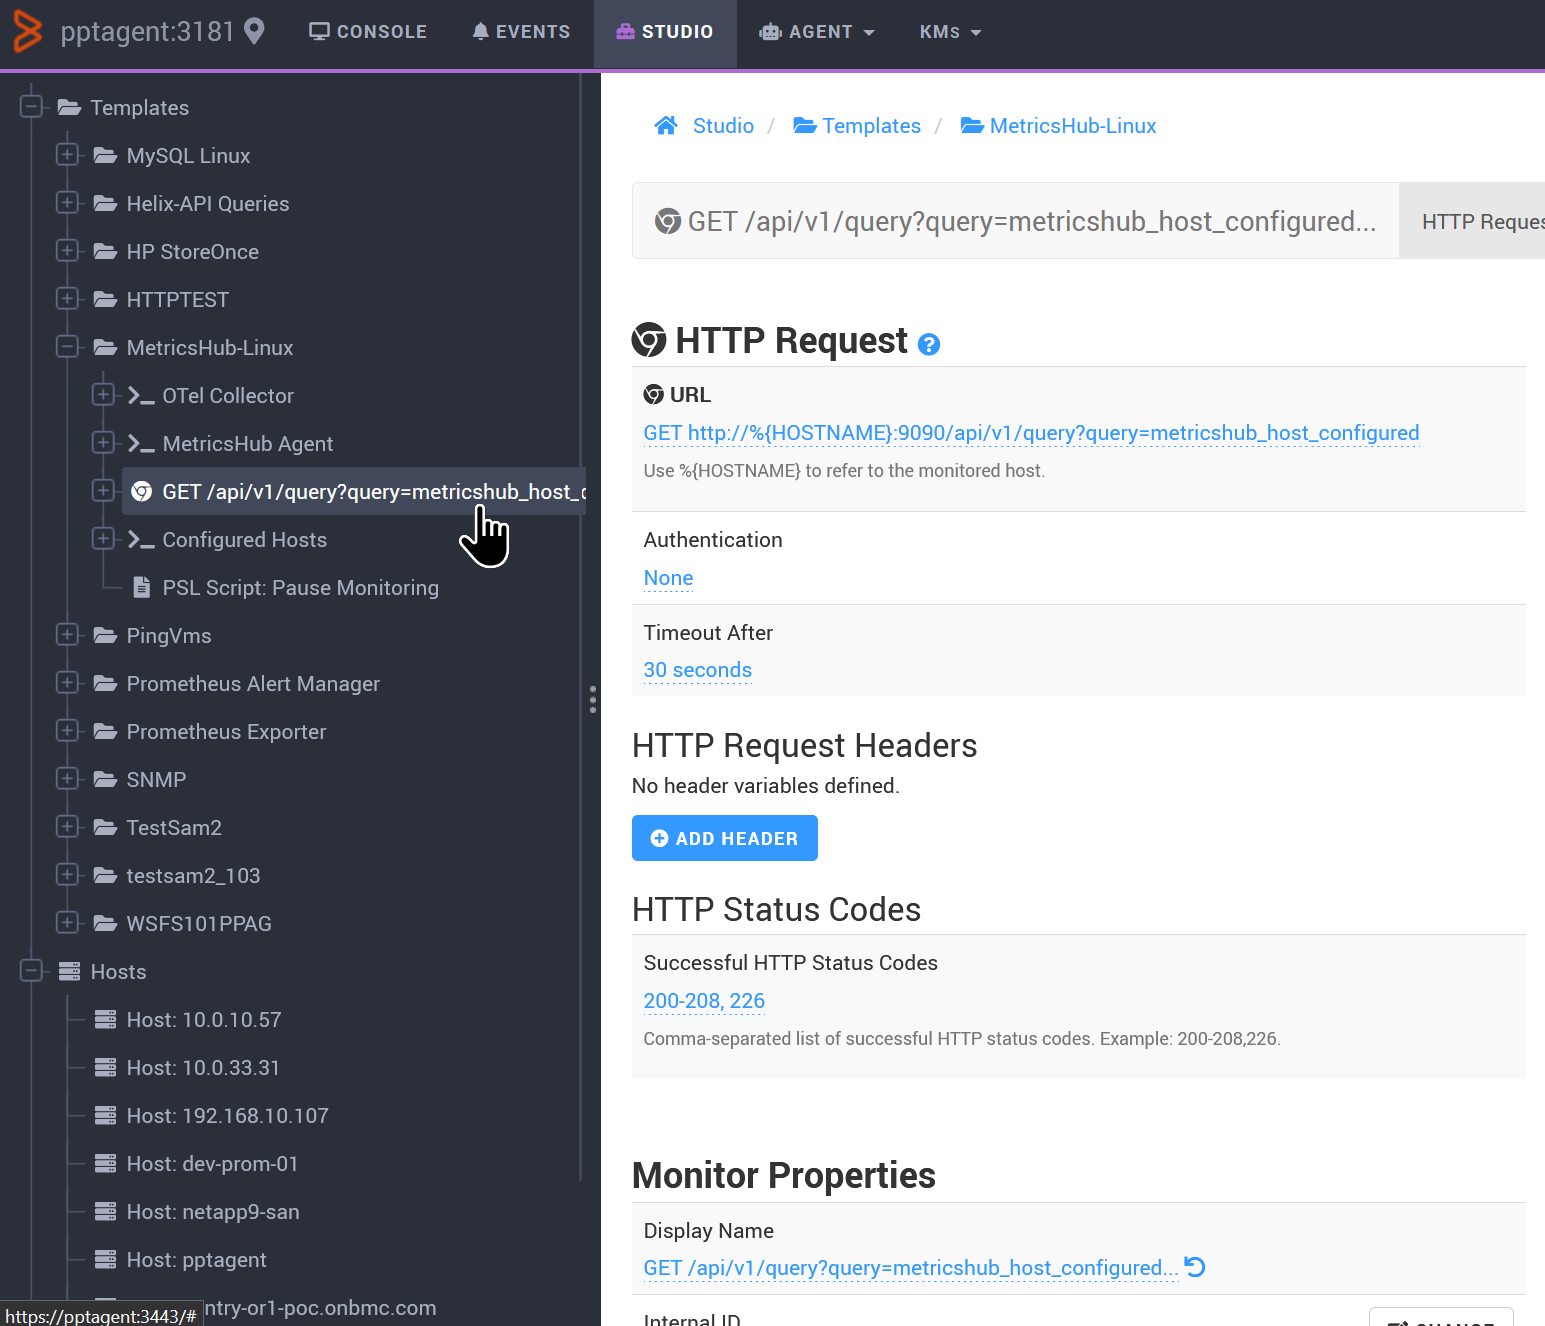
Go to the Studio tab > Templates
-
Edit your template and HTTP Request monitor:
-
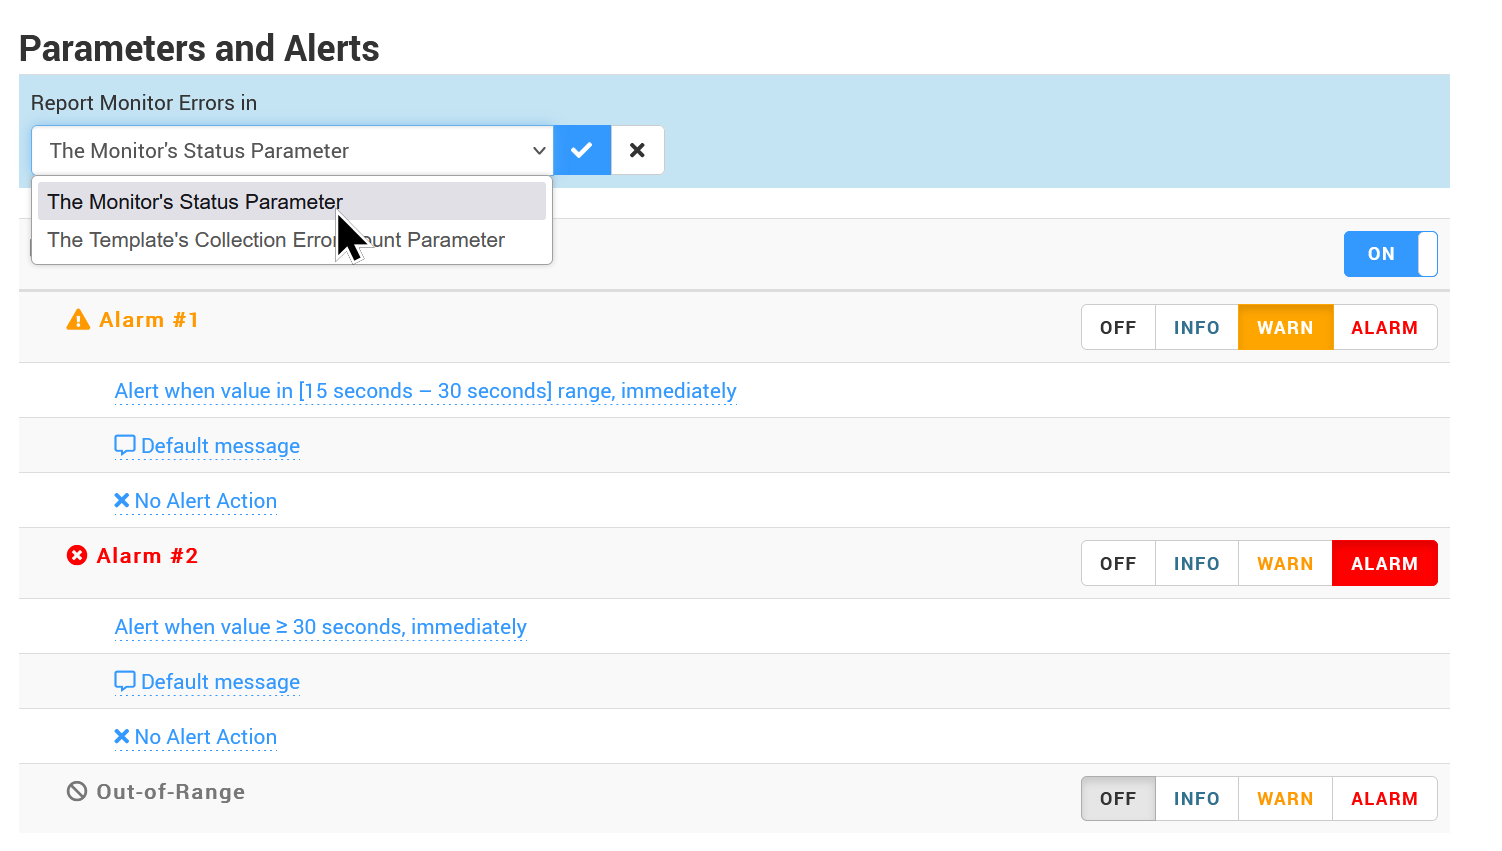
Scroll down to the Parameters and Alerts section
-
From the Report Monitor Errors in dropdown list, select The Monitor’s Status Parameter:
-
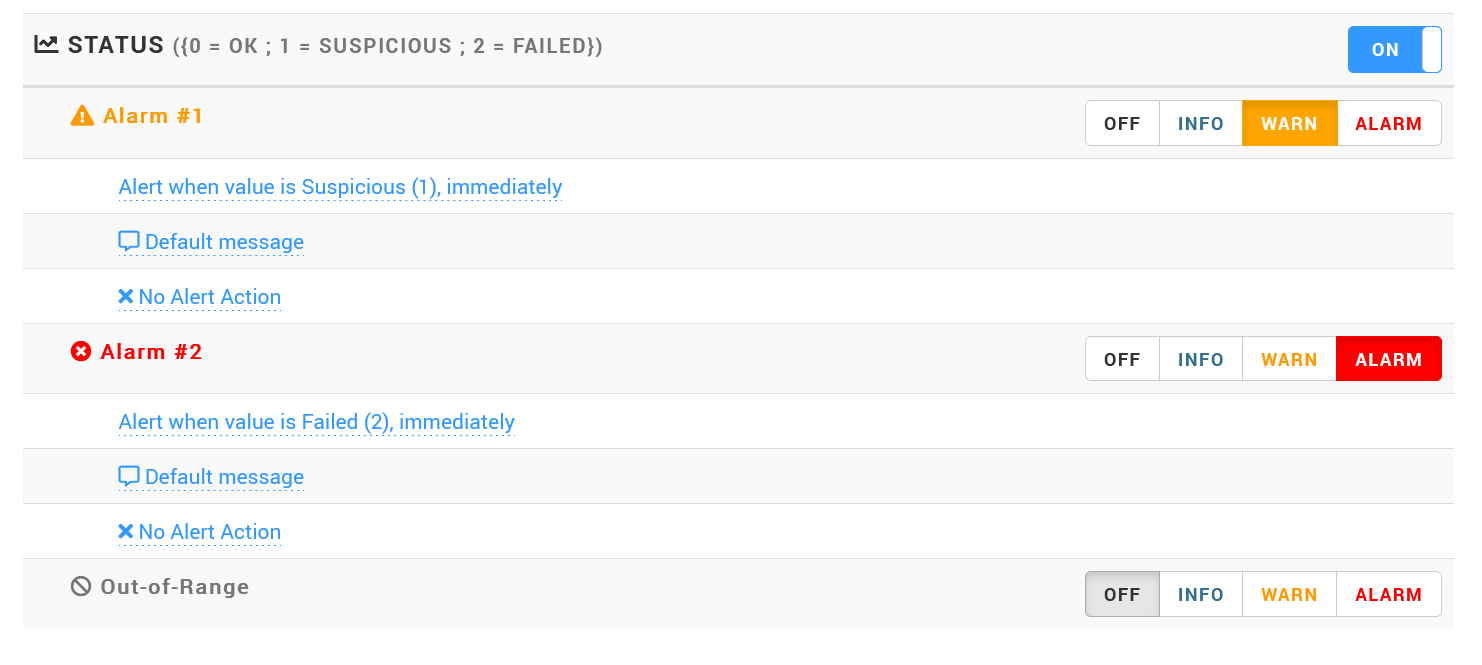
(Optional) Customize the thresholds, default message, and alert action of the (HTTP) Status parameter:
-
Save your template.
-
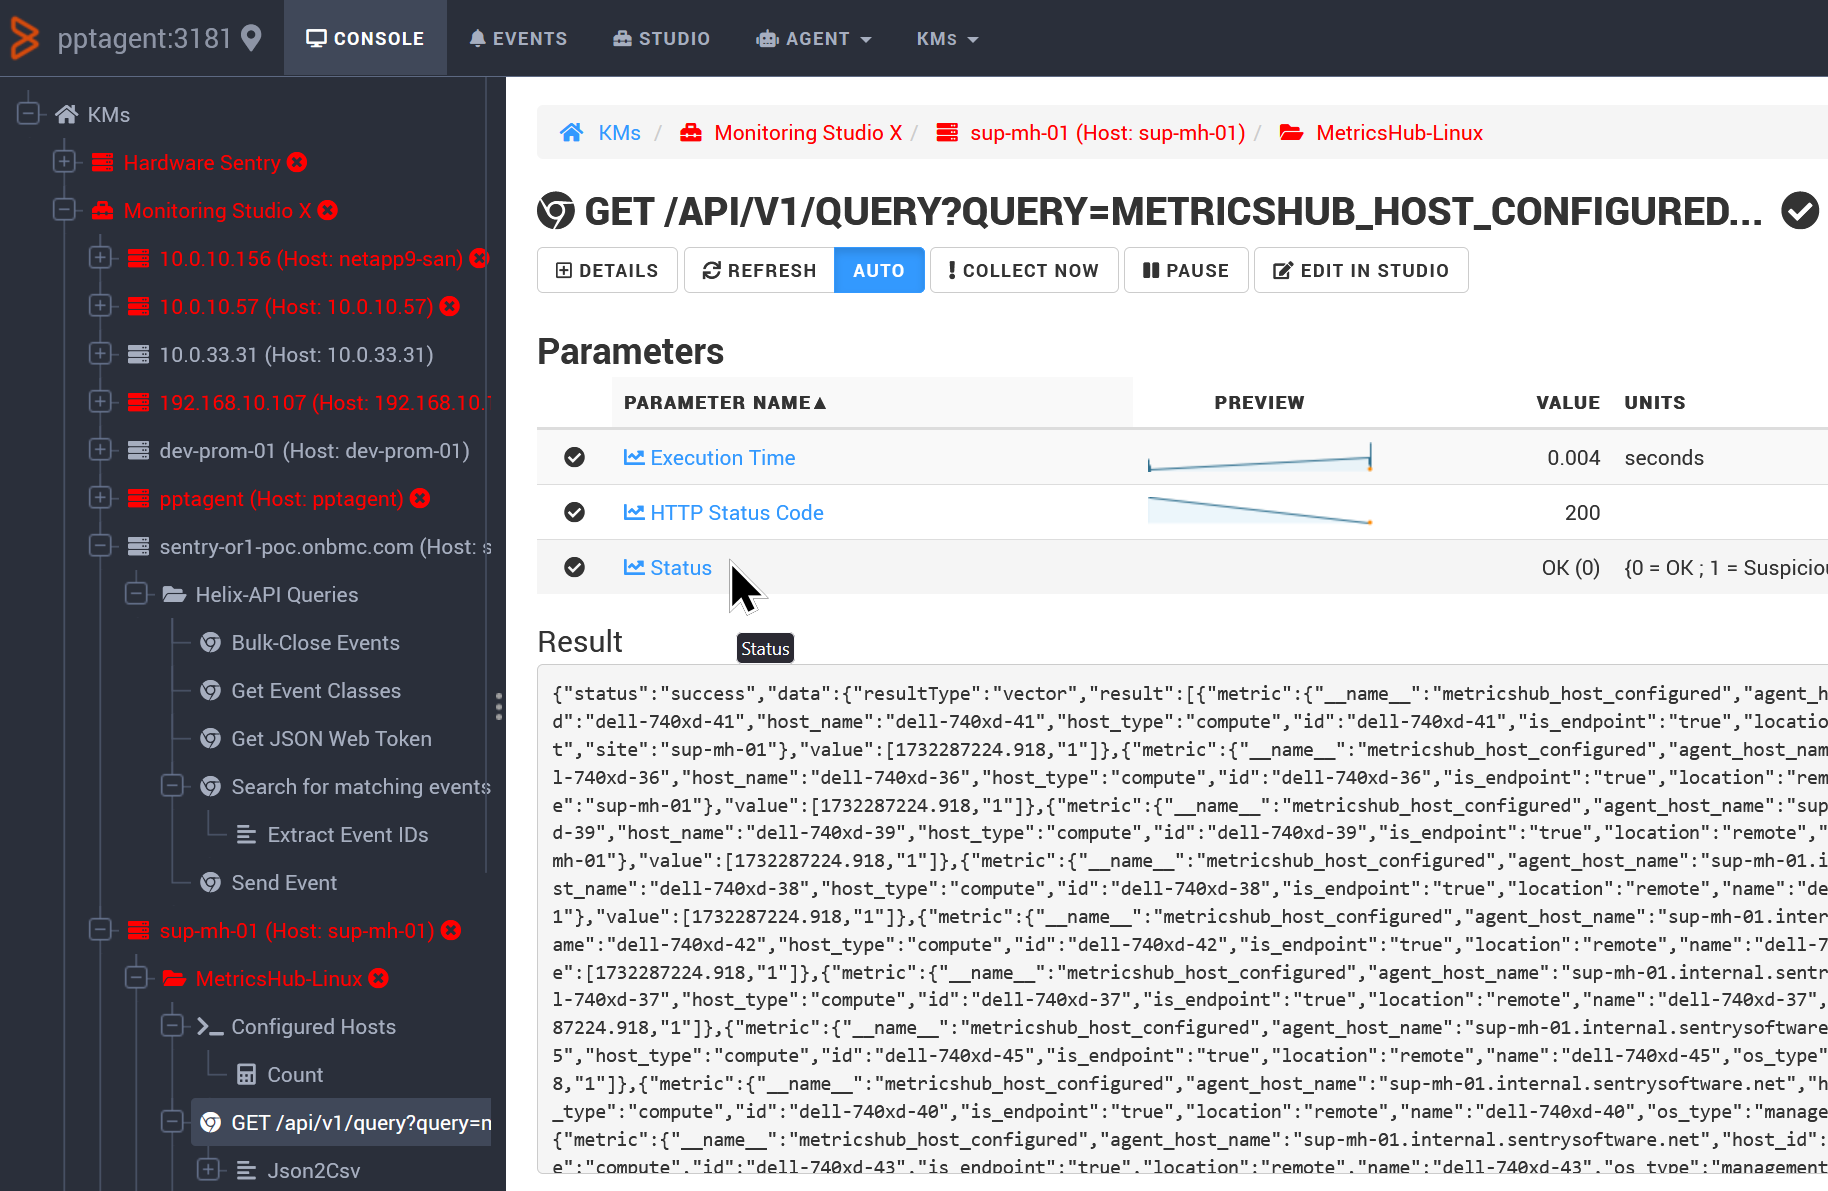
Go back to the Console tab to verify that the HTTP Status parameter is now present for the HTTP Request monitor:
Related Topics
- Monitoring Microsoft SQL Server with Monitoring Studio X v10.4+,using Active Directory-integrated Authentication
- Identifying and Locating Storage Devices in BMC Helix Operations Management
- How to Migrate Monitoring Studio X Policies from TrueSight to Helix Operations Management
- Monitoring Studio X: HTTP Proxy Authentication Fails When Using Java 8 Update 111 or Later
- Monitoring SharePoint 2016 and 2019 with Monitoring Studio X
