Downloads
Introduction
This article explains how to import the pre-built configuration into Monitoring Studio to monitor EMC ECS v3.0.
Monitored Parameters
The pre-built configuration was developed for EMC ECS v3.0 and collects the metrics listed below. If you are using older versions, the objects discovered may differ.
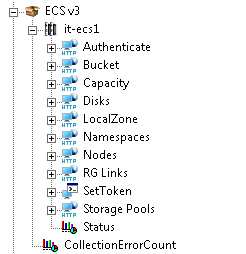
- Buckets
- Locked Status
- Cluster Capacity
- Total Free Space
- Total Provisioned Space
- Disks
- Allocated Space
- Allocated Space Percentage
- Free Space
- Total Space
- Health Status
- LocalZone
- Bad Disks
- Bad Nodes
- Geo Copy Avg Size
- Recovery Rate
- Replication Egress Traffic Bandwidth
- Replication Ingress Traffic Bandwidth
- Transaction Read Bandwidth
- Transaction Read Latency
- Transaction Read TPS
- Transaction Write Bandwidth
- Transaction Write Latency
- Transaction Write TPS
- Nodes
- Disk Read Bandwidth
- Disk Space Allocated Percentage
- Disk Space Free
- Disk Space Offline
- Disk Space Total
- Disk Write Bandwidth
- Health Status
- Memory Utilization Mbytes
- Memory Utilization Percent
- Nic Bandwidth Percent
- Node Cpu Utilization Percent
- Number of Bad Disks
- Total Number of Disks
- Number of Good Disks
- Transaction Read TPS
- Transaction Write TPS
- Transaction Errors per Sec
- Transaction Read Bandwidth
- Transaction Read Latency
- Transaction Write Bandwidth
- Transaction Write Latency
- RG Links
- Failover Progress Percent
- Failover State
- Journal Pending Failover Rereplication Total Size
- Journal Pending Replication Total Size
- Link Status
- Repo Pending Failover Rereplication Total Size
- Repo Pending Replication Total Size
- Storage Pools
- Bad Disks
- Bad Nodes
- Disk Space Allocated
- Disk Space Allocated Percentage
- Disk Space Total
- Disk Space Free
- Nodes with Sufficient Disk Space
Importing the Pre-Built Configuration
Pre-requisites
Before using the pre-built configuration, make sure that:
- the PATROL Agent 9.6 or later is installed and properly configured,
- Monitoring Studio KM 9.4.00 or higher is installed with the latest patches and loaded on the PATROL Agent
- You have access to the EMC ECS API running on port 4443 from the server running the PATROL Agent.
Procedure
-
Download the configuration file, unzip and copy it on the server where the PATROL Agent is installed and loaded with the Monitoring Studio KM.
-
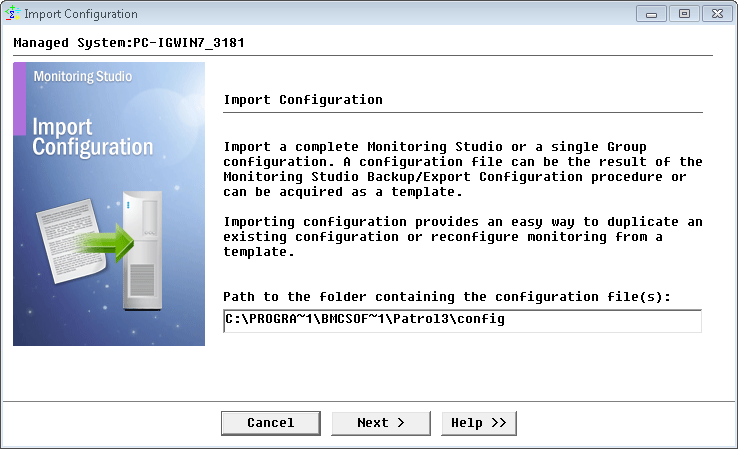
Right-click on the main Monitoring Studio icon > KM Commands > Configuration > Import Configuration…
-
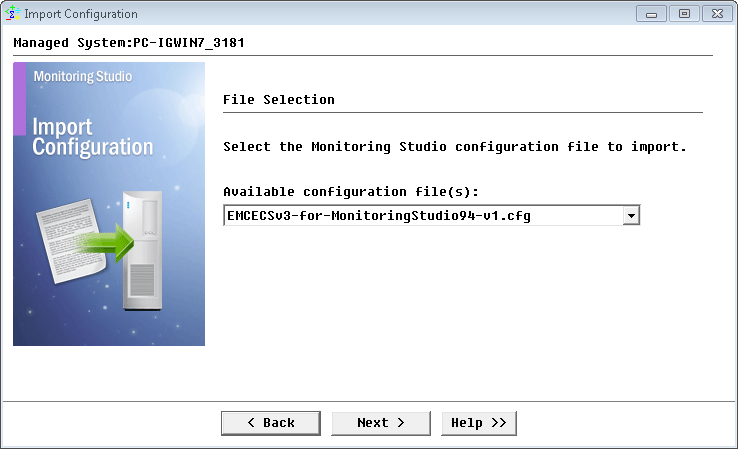
Locate the folder where the downloaded .cfg file is saved and select the EMC ECS configuration file.
-
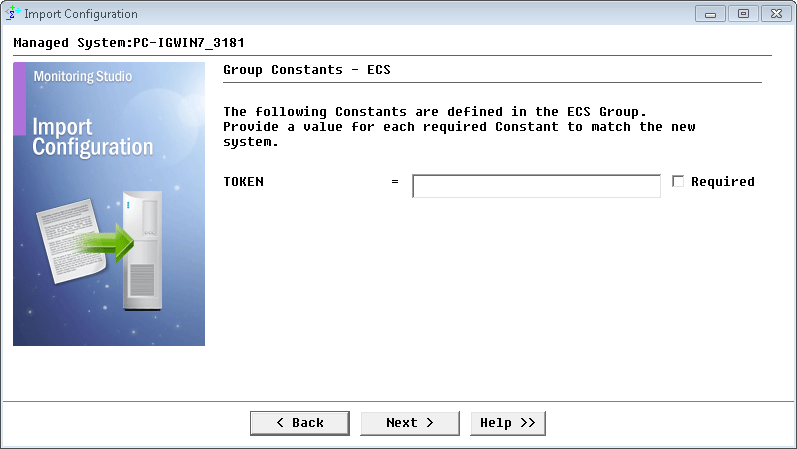
Leave the TOKEN constant value empty and click Next.
-
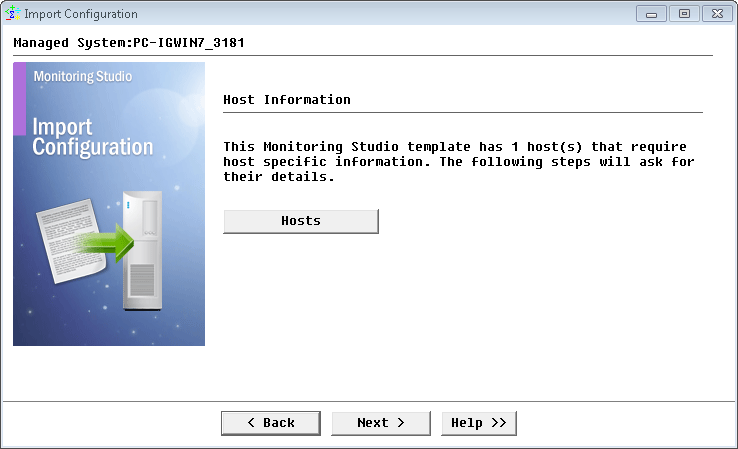
Monitoring Studio indicates the number of hosts found in the configuration file that require specific information before being imported. You can click the Hosts button to view the list. Click Next.
-
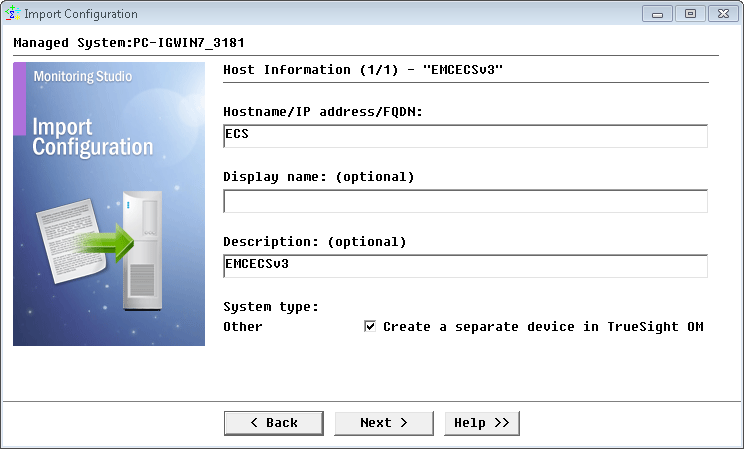
Provide the hostname or IP address of the EMC ECS cluster to be monitored and click Next.
-
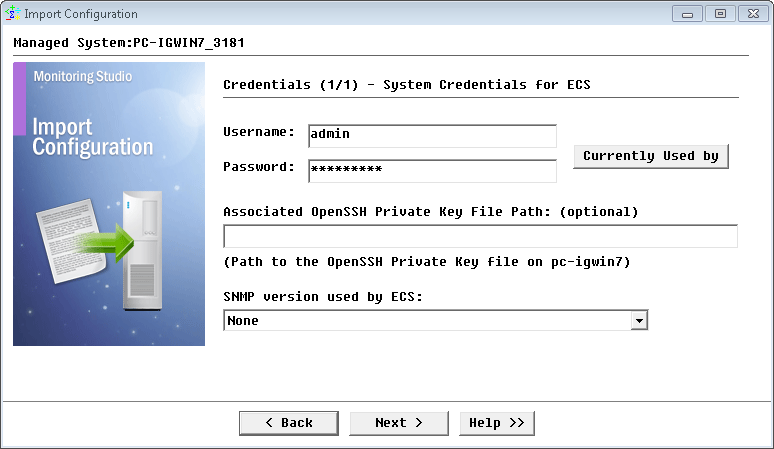
Specify the credentials to access the EMC ACS API and click Next.
-
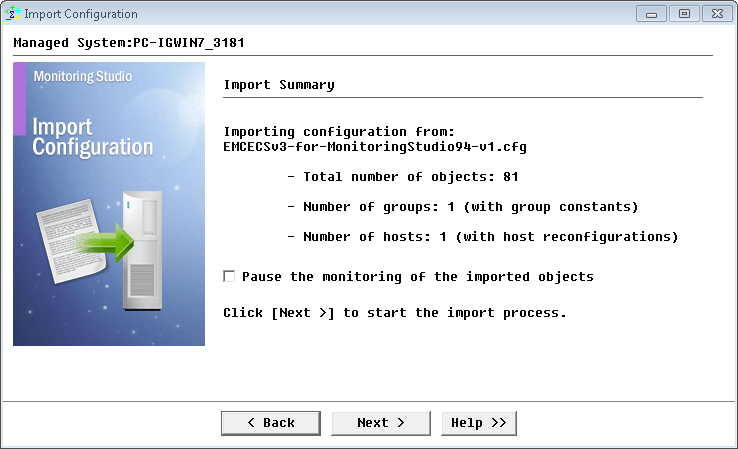
Review the Import Summary and click Next.
-
Click Finish.
-
Once the configuration is loaded, right-click on the ECS v3 group icon and click Refresh Parameters. This will generate a new token to access the API. This new token will be used in the Web Requests.
Learn More
To learn more about the Monitors used in this configuration template, please refer to the Specifying the Monitors Used section of the user documentation.
Please refer to Professional Services page to learn more about the consulting services available.
Related Topics
- Monitoring Proxmox Systems using Monitoring Studio KM
- Monitoring Squid Cache Proxy using Monitoring Studio KM
- Monitoring Dell EMC Avamar Appliances using Monitoring Studio KM
- Monitoring NetApp E Series Storage Devices using Monitoring Studio KM
- Monitoring EMC ViPR Controllers using Monitoring Studio KM