Downloads
Introduction
This article explains how to import the pre-built configuration into Monitoring Studio to monitor the capacity, traffic and status of the Nutanix appliances.
Monitored Parameters
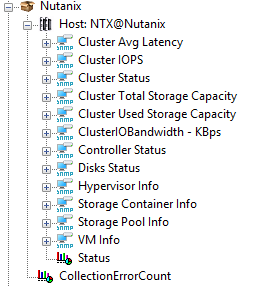
The pre-built configuration collects the following metrics:
-
Cluster Avg Latency
-
Cluster IOPS
-
Cluster Status
-
Cluster Total Storage Capacity
-
Cluster Used Storage Capacity
-
Cluster IO Bandwidth
-
Controller
-
Data Service Status
-
Metadata Service Status
-
Node Status
-
-
Disks
-
Available Space
-
Avg IO Latency
-
IO Bandwidth
-
IOPS
-
State
-
Total Size
-
-
Hypervisor
-
CPU Count
-
CPU Usage Percent
-
IO Bandwidth
-
Memory
-
Memory Usage Percent
-
Read IOPS
-
Received Bytes
-
Rx Packets Dropped
-
Total VMs
-
Transmitted Bytes
-
Tx Packets Dropped
-
Write IOPS
-
-
Storage Container
-
Avg IO Latency
-
IO Bandwidth
-
IOPS
-
Total Capacity
-
Used Capacity
-
-
Storage Pools
-
Avg IO Latency
-
IO Bandwidth
-
IOPS
-
Total Capacity
-
Used Capacity
-
-
VM
-
Avg Latency
-
CPU Count
-
CPU Usage Percent
-
IO Bandwidth
-
Memory
-
Memory Usage Percent
-
Read IOPS
-
Received Bytes
-
Rx Packets Dropped
-
Total VMs
-
Transmitted Bytes
-
Tx Packets Dropped
-
Write IOPS
-
Importing the Pre-Built Configuration
Pre-requisites
Before using the pre-built configuration, make sure that:
-
the PATROL Agent 9.6 or later is installed and properly configured,
-
Monitoring Studio KM 9.4.00 or higher is installed with the latest patches and loaded on the PATROL Agent
-
You have access to the SNMP agent on the Nutanix appliance through SNMP v1, v2c, or v3.
Procedure
-
Download the configuration file, unzip and copy it on the server where the PATROL Agent is installed and loaded with the Monitoring Studio KM.
-
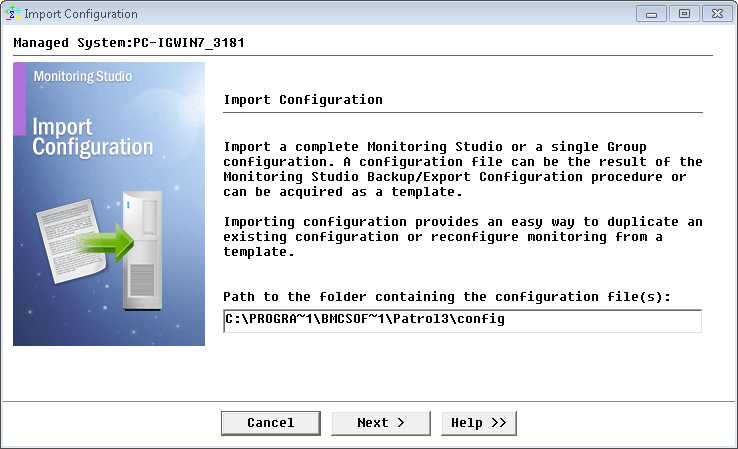
Right-click on the main Monitoring Studio icon > KM Commands > Configuration > Import Configuration…
-
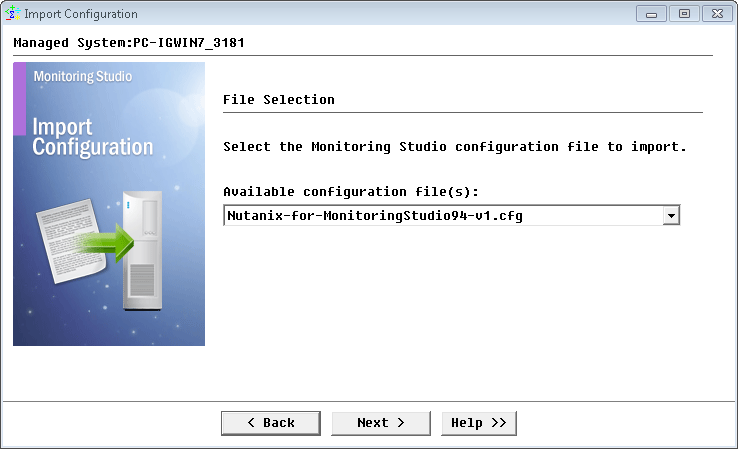
Locate the folder where the downloaded .cfg file is saved and select the Nutanix configuration file.
-
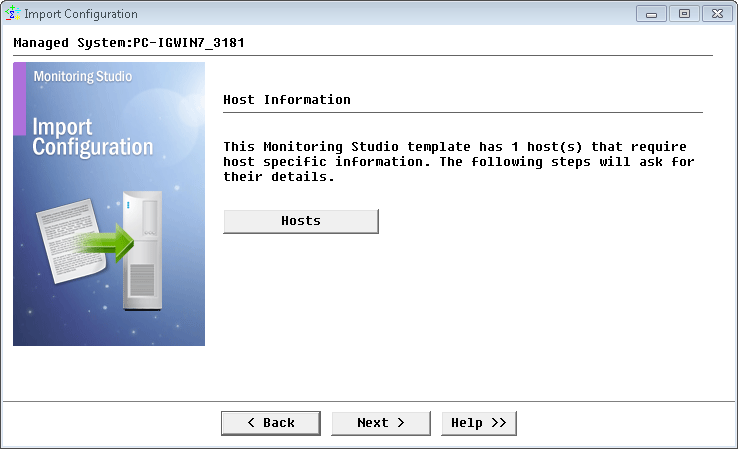
Monitoring Studio indicates the number of hosts found in the configuration file that require specific information before being imported. You can click the Hosts button to view the list. Click Next.
-
Enter the Nutanix Cluster hostname and click Next.
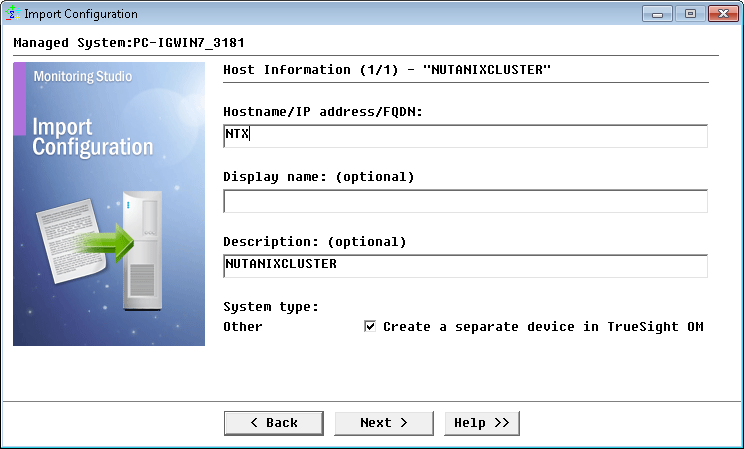
-
Select the appropriate SNMP version used by the Nutanix appliance and click Next.
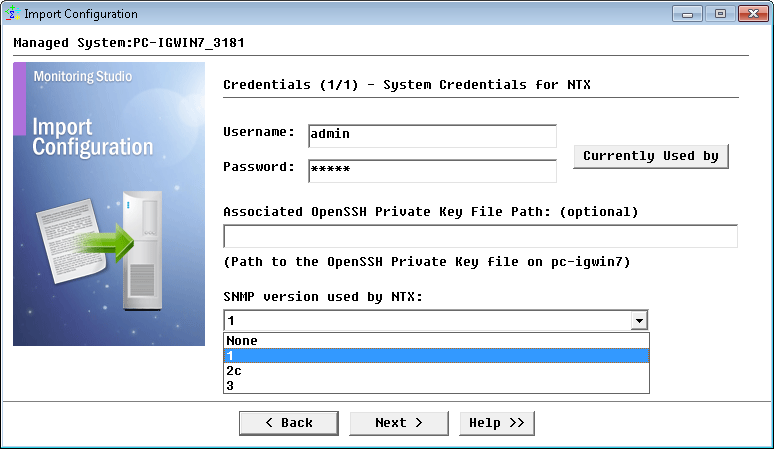
-
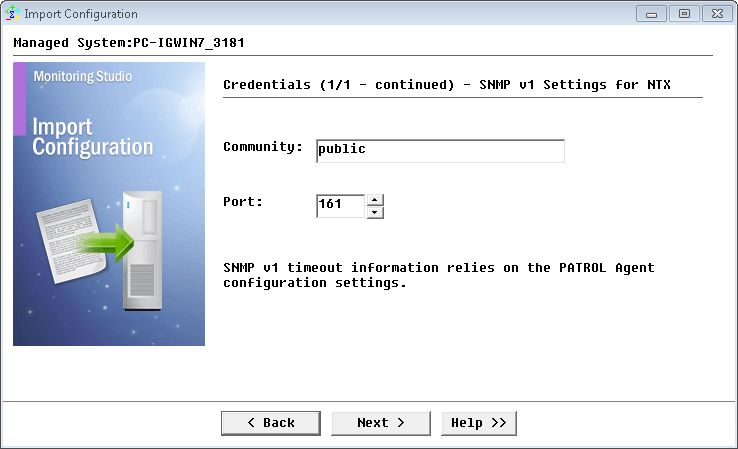
For SNMP v1 and v2c, provide the SNMP community string; for SNMP v3 enter the credentials and click Next.
-
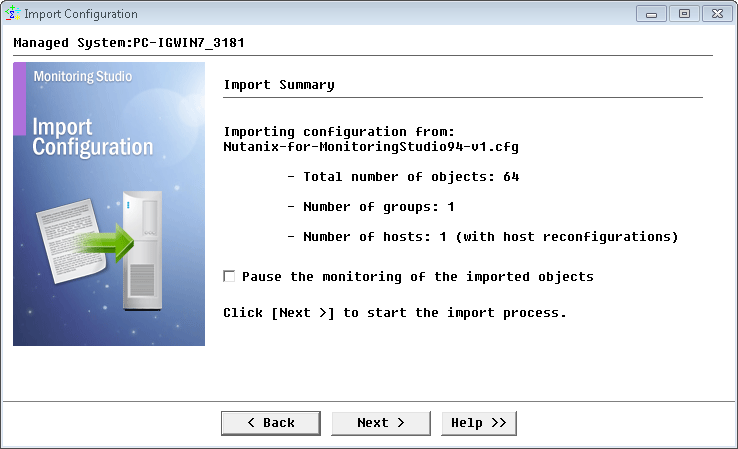
Review the Import Summary and click Next.
-
Click Finish to launch the discovery.
Learn More
To learn more about the monitors used in this configuration template, please refer to the Specifying the Monitors Used section of the user documentation.
Please refer to Professional Services page to learn more about the consulting services available.
Related Topics
- Monitoring Proxmox Systems using Monitoring Studio KM
- Monitoring Squid Cache Proxy using Monitoring Studio KM
- Monitoring Dell EMC Avamar Appliances using Monitoring Studio KM
- Monitoring NetApp E Series Storage Devices using Monitoring Studio KM
- Monitoring EMC ViPR Controllers using Monitoring Studio KM