Downloads
Introduction
This article explains how to import the pre-built configuration into Monitoring Studio to monitor the capacity and performance of the EMC Data Domain storage devices through SNMP. The Sentry Storage Analyzer for TrueSight OM license is required to use Monitoring Studio.
The pre-built configuration does not cover all the monitoring aspects of EMC Data Domain storage devices. It is provided as an example and can be used as a working base for advanced monitoring. No support will be provided for this prebuilt configuration. Should you need further assistance to customize it, please contact our Professional Services team.
The pre-built configuration collects the following metrics:
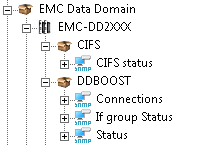 |
CIFS
DDBOOST
|
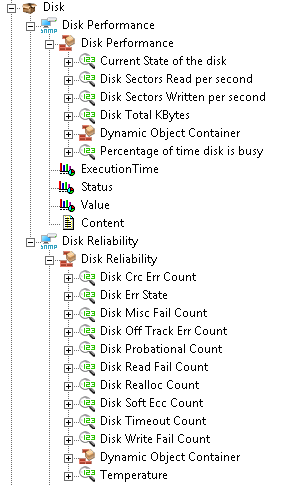 |
Disk
|
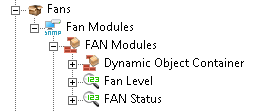 |
Fans
|
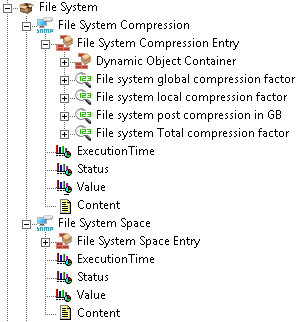 |
File System
|
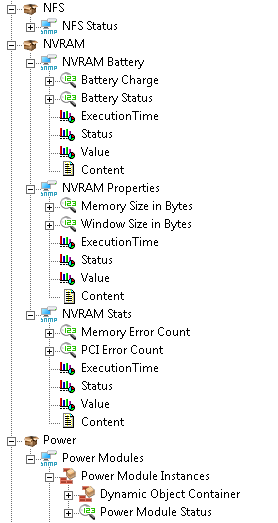 |
NFS
NVRAM
Power
|
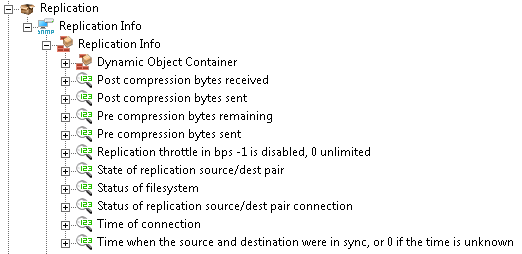 |
Replication
|
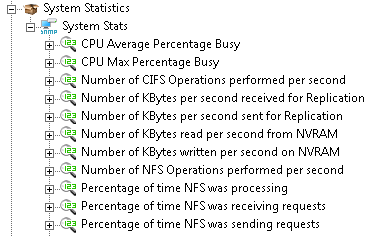 |
System Statistics
|
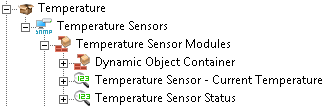 |
Temperature
|
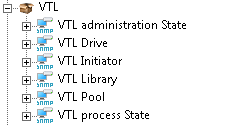 |
VTL
|
Importing the Pre-Built Configuration
Pre-requisites
Before using the pre-built configuration, make sure that:
- You have access to the SNMP agent embedded on the EMC Data Domain storage device through SNMP v1, v2c, or v3
- PATROL Agent 9.6 or later is installed and properly configured
- Monitoring Studio KM 9.4 or later is installed with the latest patches, is loaded on the PATROL agent, and that the snmpRetryIntervals configuration variable is set to 60000 ms.
Procedure
- Download the EMC-DataDomain-for-MSv9.x-v1.cfg file and copy it on the server where the PATROL Agent and the Monitoring Studio KM are installed.
- Right-click on the main Monitoring Studio icon > KM Commands > Configuration > Import Configuration
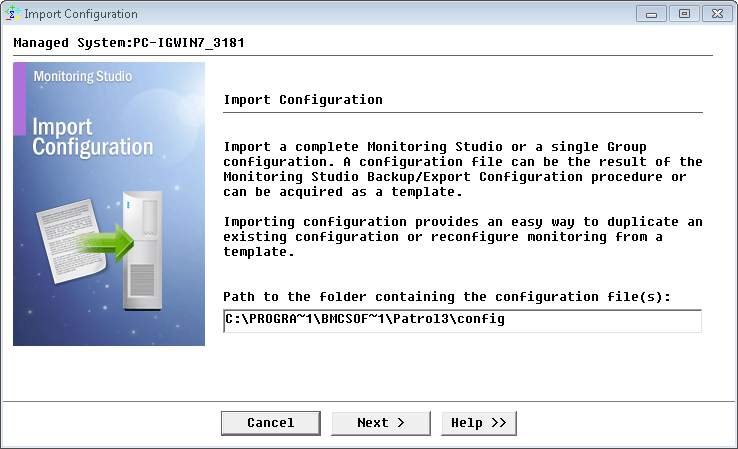
Importing the EMC Data Domain pre-built configuration
- Navigate to the folder where the downloaded cfg file is copied and choose the EMC-DataDomain-for-MSv9.x-v1.cfg
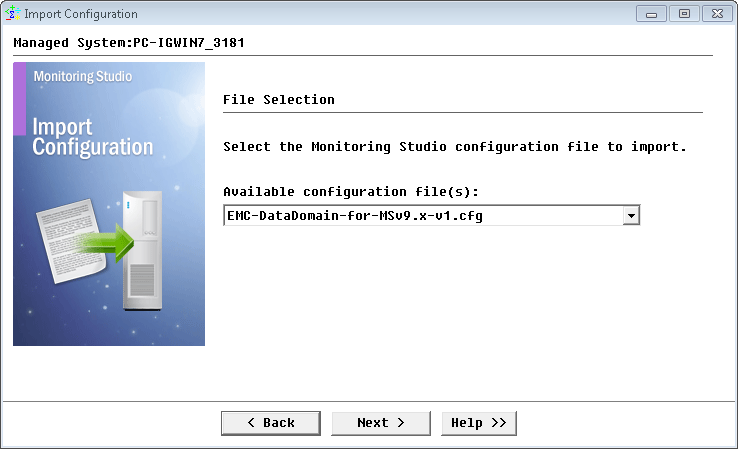
Selecting the EMC Data Domain pre-built configuration to import
- Review the Import Summary and click Next.
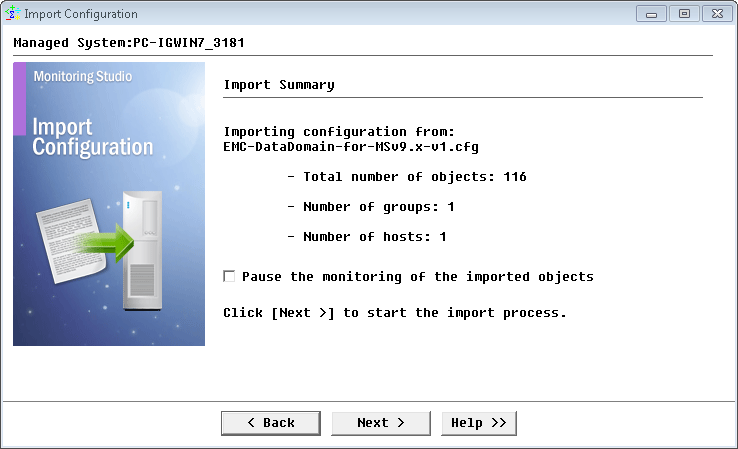
Reviewing the EMC Data Domain pre-built configuration import summary
- When import is complete, click Finish.
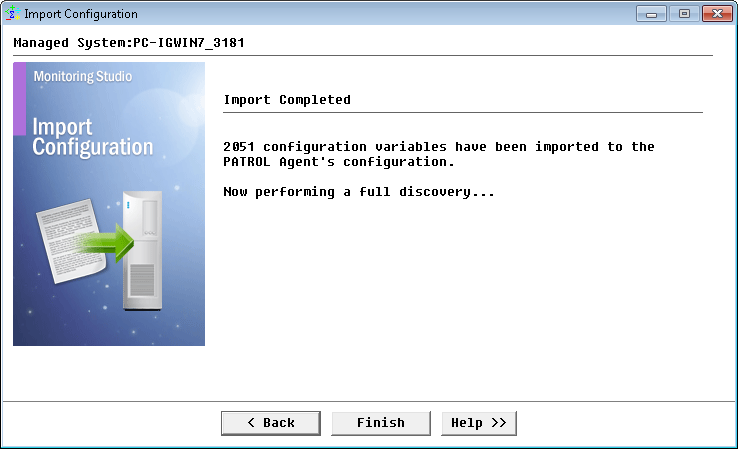
EMC Data Domain pre-built configuration import complete
- In the PATROL Console, under the EMC Data Domain container, right-click the EMC-DD2XXX host and click Edit.
- Specify the hostname or IP address of the EMC Data Domain storage device to be monitored and click Next.
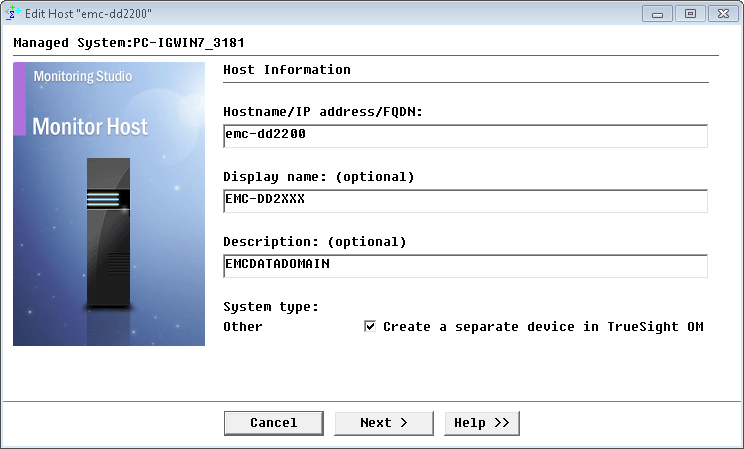
Specifying the hostname or IP address of the EMC Data Domain storage device to be monitored
- Specify the SNMP version used and click Next.
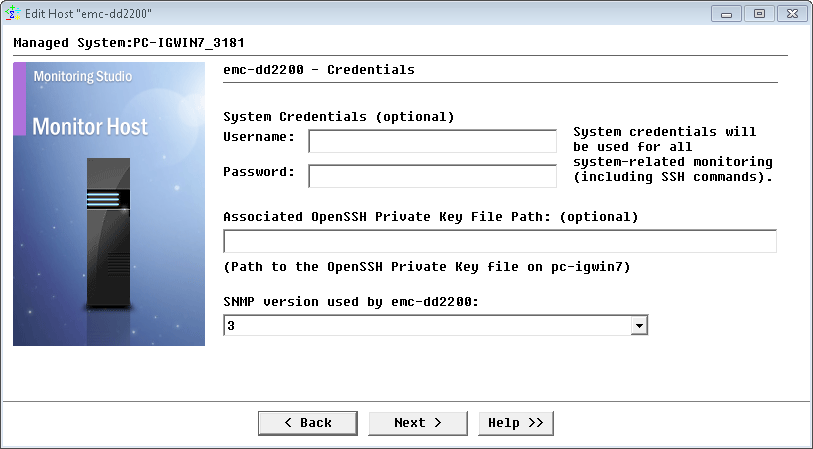
Selecting the version of the SNMP used
- For SNMP v1 and v2c, provide the SNMP community string; for SNMP v3 enter the credentials and click Next.
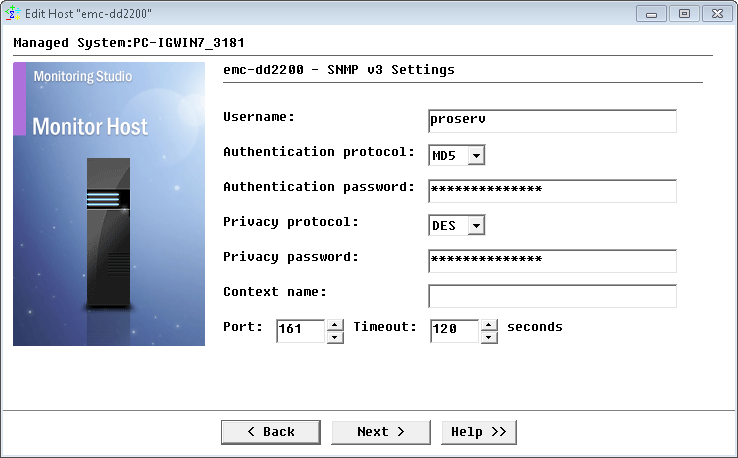
Configuring SNMP settings
- Click Finish to start the discovery.
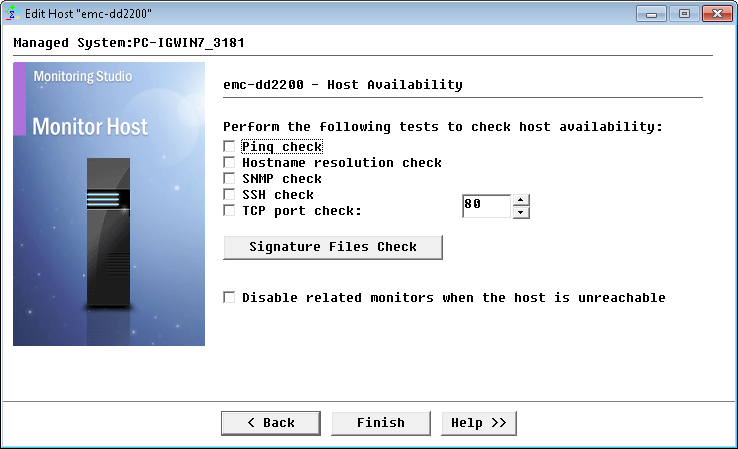
Specifying the tests to perform to check host availability
Learn More
To learn more about the monitor types used in this configuration template, please refer to the Specifying the Monitors Used section of the user documentation.
Please refer to Professional Services page to learn more about the consulting services available.
Related Topics
- Monitoring the EMC SMI-S Provider with Monitoring Studio
- Monitoring EMC RecoverPoint Storage Devices with Monitoring Studio
- Monitoring EMC Atmos Storage Devices with Monitoring Studio
- Monitoring EMC Isilon Storage Devices with Monitoring Studio
- Monitoring Nimble Storage Appliances with Monitoring Studio