Objective
When setting the monitoring of a Windows Performance Counter within the PATROL Console (KM Commands > New > Monitor...), the Monitoring Studio KM retrieves and displays the list of all available Performance Objects on the monitored system.
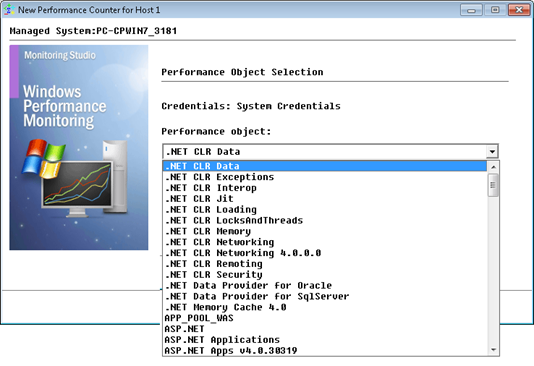
However, performing the same operation with Central Monitoring Administration (CMA) in TrueSight Operations Management requires to know the names of the Performance Objects and Performance Counters to monitor as their list is not available.
This article explains how to get the list of Windows Performance Objects and Performance Counters to successfully configure the monitoring of Windows Performance Counters in CMA.
Procedure
To get the list of Windows Performance Objects and Performance Counters, you can use, among other tools, the Windows Management Instrumentation Tester tool (wbemtest.exe).
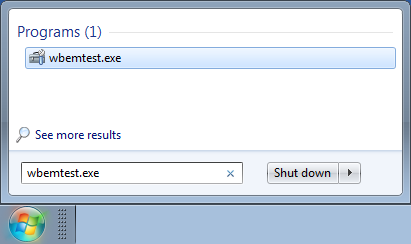
- Click the Start button, and type “wbemtest.exe” to run the utility.
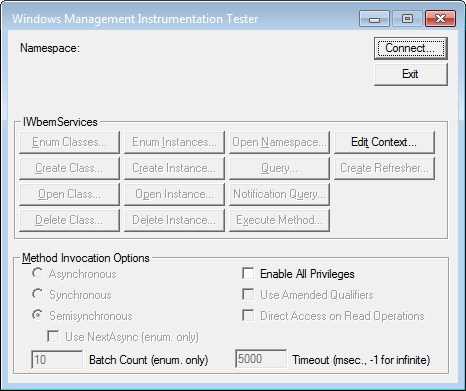
- Click the Connect… button.
- The Connect window opens:
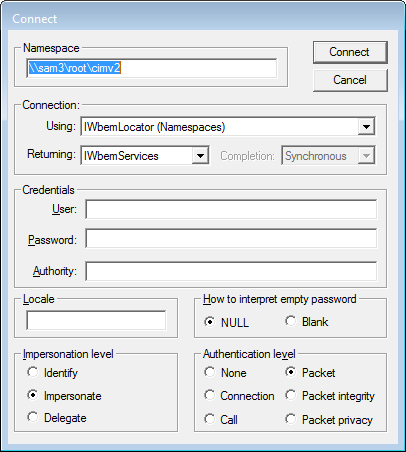
- In the Namespace field, enter \\<hostname>\root\cimv2 where <hostname> needs to be replaced with the actual hostname or IP address of the remote system you want to connect to or root\cimv2 to connect to your localhost.
- (optional) Provide Credentials if the system you need to access requires secure access.
- Click Connect.
- Once connected, under IWbem Services, click the Enum Classes... button.
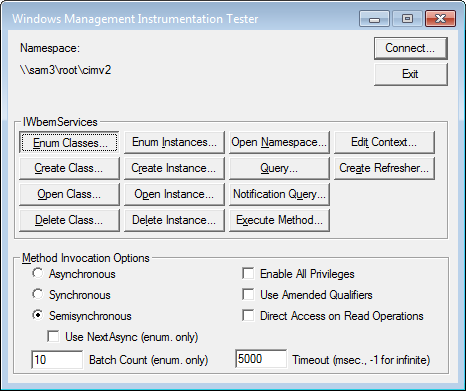
- The Superclass Info window opens:
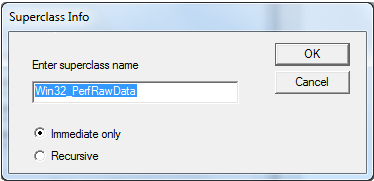
- In the superclass name field, type “Win32_PerfRawData”.
- Select the Immediate only option.
- Click OK.
- The Superclass Info window opens:
- The complete list of Performance Objects available on the system is then displayed:
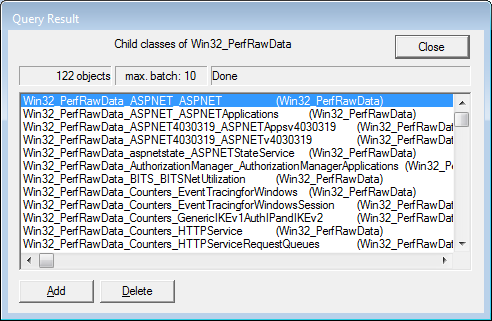
For example:
- Win32_PerfRawData_ASPNET_ASPNET
- Win32_PerfRawData_ASPNET_ASPNETApplications
- Win32_PerfRawData_ASPNET4030319_ASPNETAppsv4030319
- Win32_PerfRawData_ASPNET4030319_ASPNETv4030319
- Win32_PerfRawData_aspnetstate_ASPNETStateService
- Under IWbem Services, click the Enum Instances... button.
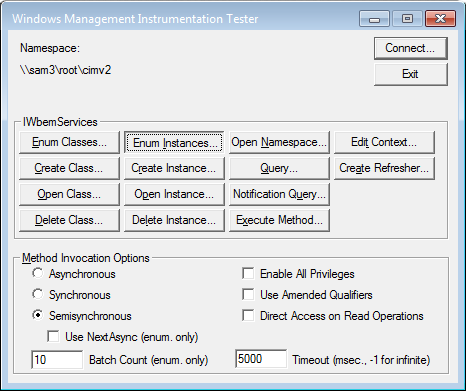
- The Class Info window opens:
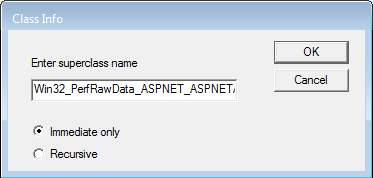
- Choose one Performance Object from the list of Performance Objects available on your system and enter its name in the superclass name field (“Win32_PerfRawData_ASPNET_ASPNETApplications” in our example)
- Select the Immediate only option.
- Click OK.
- The Class Info window opens:
- The Query Result window opens. Double-click on the result displayed.
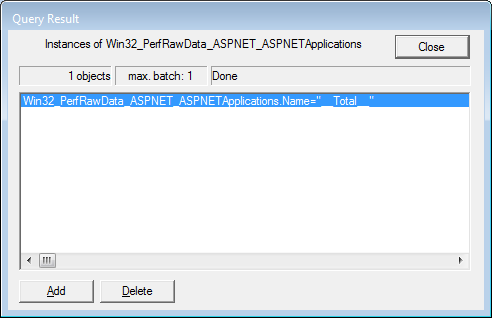
- The Object editor window opens. Click the Show MOF button.
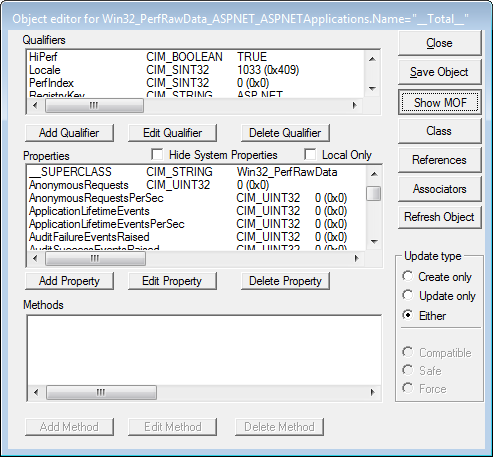
- The list of Performance Counters is then displayed:
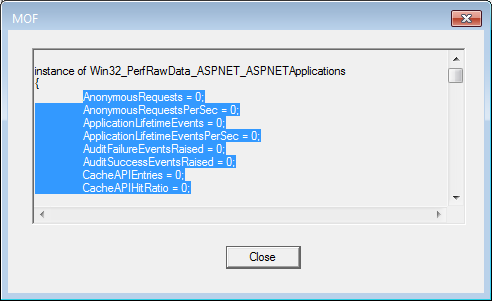
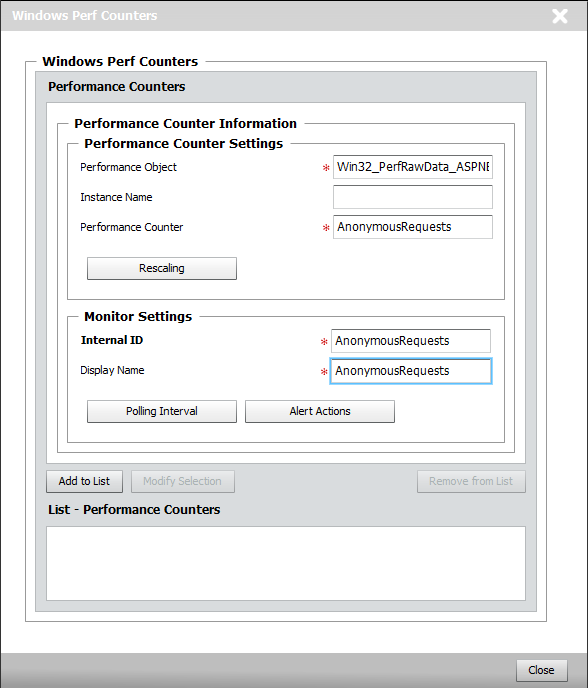
- Use the retrieved information to finally configure the monitoring of Windows Performance Counters in CMA. In our example:
- Performance Object: Win32_PerfRawData_ASPNET_ASPNETApplications
- Performance Counter: AnonymousRequests
The next step consists in retrieving the Performance Counters related to a specific Performance Object.
Related Resource
An exhaustive list of all existing Performance Objects and their associated Performance Counters, can be consulted on this website: wutils.com/wmi/root/cimv2/win32_perfrawdata/.
