Introduction
When you encounter an issue with Monitoring Studio and wish to report it to Sentry Software, you will be asked to enable the Debug Mode and provide the following debug files which are generated in the %PATROL_HOME%\log or $PATROL_HOME/log folder:
SEN_MS_debug_km_<PatrolAgent_Port>_<YYYY-mm-dd-HH-MM>.log: debug output of the KMSEN_MS_CollectionHub_debug_psl_<PatrolAgent_Port>_<YYYY-mm-dd-HH-MM>.log: PSL debug output of the Collection HubSEN_MS_CollectionHub_debug_java_<PatrolAgent_Port>_<YYYY-mm-dd-HH-MM>.log: Java debug output of the Collection Hub.
Procedure
When Using Monitoring Studio 8.x.xx
- In the PATROL Console, right-click the main Monitoring Studio icon > KM commands> Options > Debug…
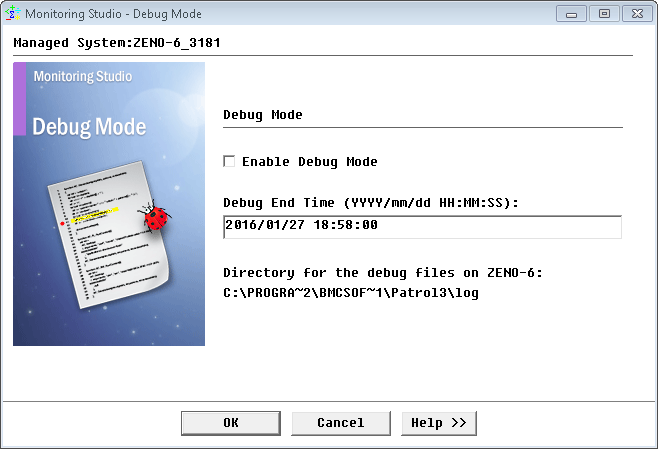
- Check the Enable Debug Mode option.
- Indicate the date and time at which the system must stop logging debug information. The required format is: YYYY/mm/dd HH:MM:SS, based on a 24 hour-day.
- Click OK.
When Using Monitoring Studio 9.0.00
In a PATROL Console
The procedure is similar to the one described for Monitoring Studio 8.x.xx
In TrueSight
- Edit your Monitoring Studio policy
- Log on to the TrueSight console.
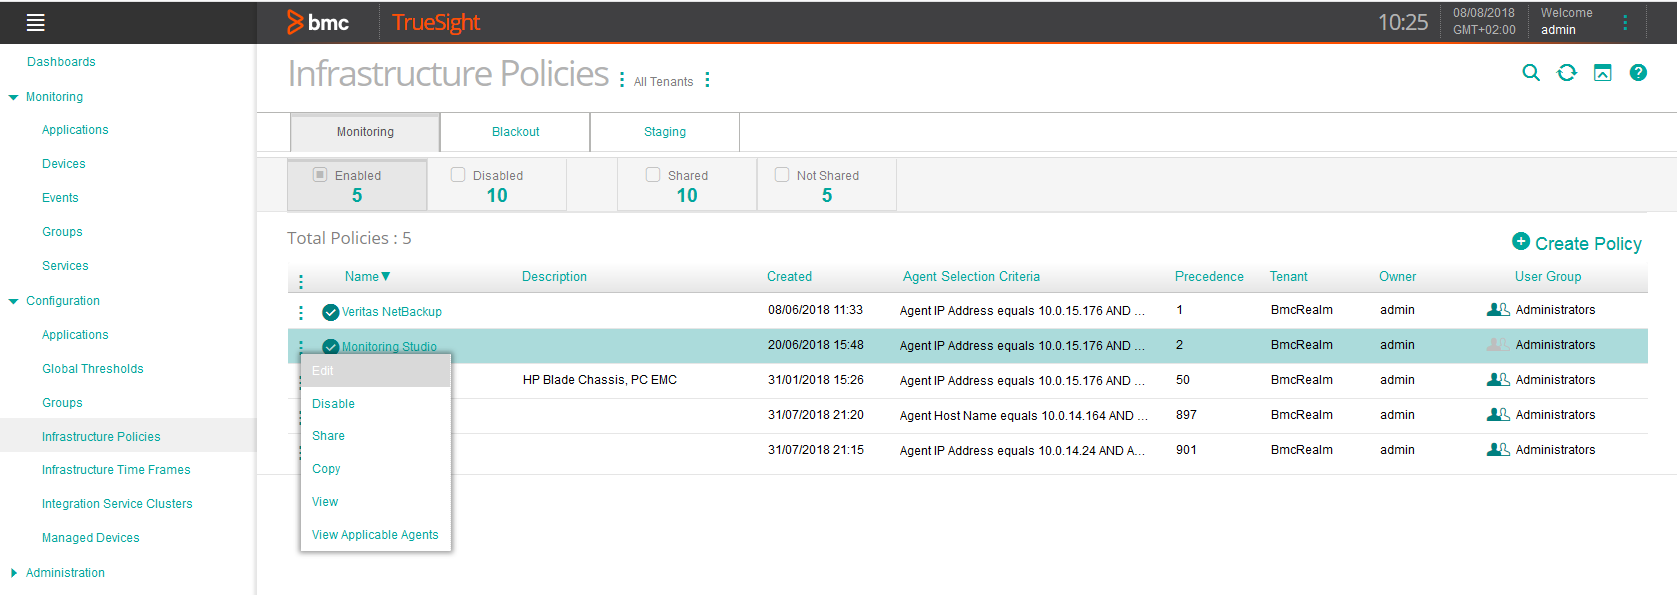
- In the navigation pane, expand Configuration and select Infrastructure Policies.
- In the Infrastructure Policies page, locate the monitoring policy you wish to modify, click its action button
 and click Edit.
- Select the Configuration Variables tab and click Add Configuration Variables
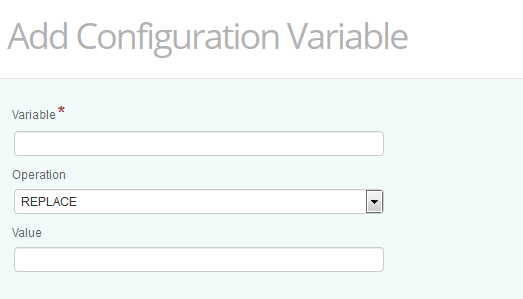
- Fill in the available fields as follows:
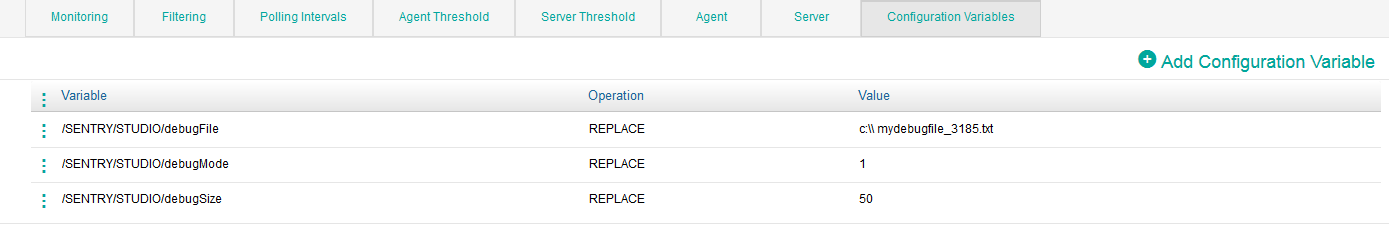
| Variable | Operation | Value |
|---|---|---|
/SENTRY/STUDIO/debugFile |
REPLACE | File path for the debug output. Example: c:\\ mydebugfile_3185.txt |
/SENTRY/STUDIO/debugMode |
REPLACE | Set to 1 to enable the debug mode. |
/SENTRY/STUDIO/debugSize |
REPLACE | Maximum size of the debug file in Megabytes. Example: 50 |
- Click OK.
- Resume the procedure to add the three required configuration variables.
- Click Save to confirm your changes. The debug file will be stored on the machine where the PATROL agent is installed.
When Using Monitoring Studio 9.1.00 and Higher
In a PATROL Console
The procedure is similar to the one described for Monitoring Studio 8.x.xx
In TrueSight
- Edit your Monitoring Studio policy
- Log on to the TrueSight console.
- In the navigation pane, expand Configuration and select Infrastructure Policies.
- In the Infrastructure Policies page, locate the monitoring policy you wish to modify, click its action button and click Edit.
- In the Edit Monitoring Policy page, locate the Monitoring Studio Configuration you wish to modify and click its action button to access the monitoring options panel.
-
Locate the Global Advanced Settings > Debug section

-
Select the Enable Debug Mode option.
-
In the Debug End Time field, enter the date and time at which the system must stop logging debug information. Required format:
yyyy/mm/dd hh:mm:ss. -
Click OK
-
Click Save. The debug file will be stored on the machine where the PATROL agent is installed.
When Using Monitoring Studio X and Higher
-
Access the Monitoring Studio X Web Interface at the following URL:
https://<patrol-agent>:<patrol-agent-port+262>/where<patrol-agent>is the name of the host on which the PATROL Agent runs<patrol-agent-port+262>is the number you obtain when you add 262 to the PATROL Agent port number.
-
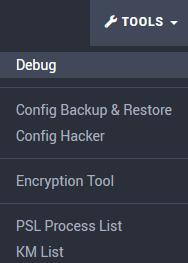
In the TOOLS menu, select Debug .
-
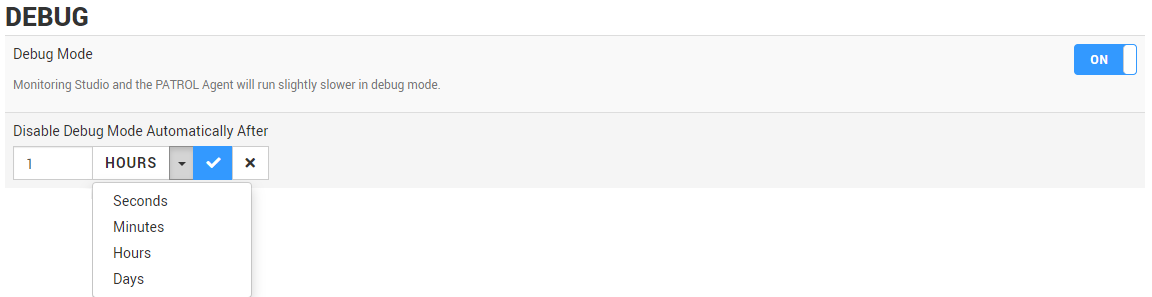
Enable the Debug Mode and indicate the time after which the system will stop logging debug information.
-
In the Debug Files section, click Refresh.
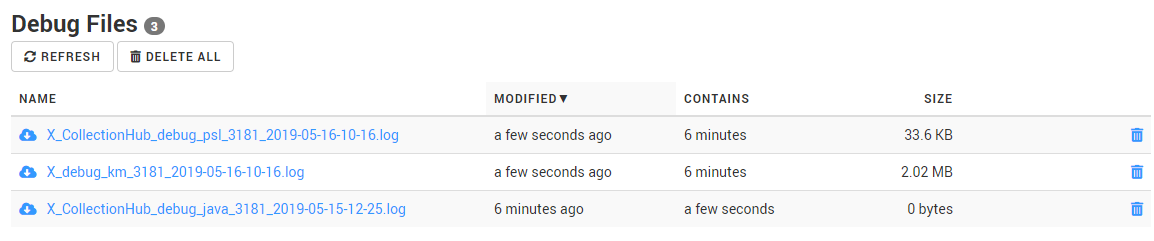
Monitoring Studio X creates 3 log files that record all the KM actions until the time you have set:
X_CollectionHub_debug_psl_{port-and-timestamp}.log: log file of the Collection Hub, the interface between PSL and the Java engineX_debug_km_{port-and-timestamp}.log: log file of the discovery and collect operations of the KMX_CollectionHub_debug_java_{port-and-timestamp}.log: log file of the Java engine of the Collection Hub
These files are saved to the $PATROL_HOME/log directory.
Related Topics
- Monitoring Studio X - Monitoring Remote Log/Flat Files
- Monitoring Studio 9: Configuring the Multi-Parameter Formula Monitor in CMA to alert only when multiple conditions are met
- SSH-based monitoring fails due to incompatible Java versions
- Loading Custom JDBC Drivers in Monitoring Studio
- Monitoring Microsoft SQL Server with Monitoring Studio 9.4.xx