Downloads
Objective
Our goal is to monitor the EMC SMI-S Provider (also known as EMC SMI-S Agent, or ECOM) through BMC PATROL (and/or BMC ProactiveNet Performance Management) to detect failures in configuration and communication issues with the EMC SMI-S Provider, errors in log files and performance problems (consumption of system resources and response times).
Question
What is the EMC SMI-S Provider and why do we need to monitor it?
The Storage Management Initiative Specification (SMI-S), is an ANSI standard for storage management developed by the SNIA. It is a specification that defines an open storage management interface to enable vendor-agnostic management and monitoring of SAN resources.
The EMC SMI-S Provider is the implementation of the SMI-S standard by EMC. It is part of EMC Solutions Enabler and is sometimes called “EMC SMI-S Agent” or “ECOM”. It is a simple Windows service or Linux daemon that runs in the background and that can be queried by 3rd party software to gather information about the EMC storage environment that the EMC SMI-S Provider exposes. The storage systems (EMC Symmetrix, CLARiiON and VNX) need to be declared in the EMC SMI-S Provider, as explained here.
These BMC and Sentry’s storage management solutions rely on the EMC SMI-S Provider to monitor and manage EMC storage systems:
BMC PATROL, BMC ProactiveNet Performance Management (BPPM)
- Hardware Sentry KM for PATROL
- EMC Disk Arrays KM for PATROL
BMC Portal
- BMC Performance Manager Express for EMC Disk Arrays
BMC TrueSight Capacity Optimization
- EMC SMI-S Provider ETL for BMC TrueSight Capacity Optimization
BMC Atrium Orchestrator (BAO)
- BAO Application Adapter for EMC Storage
Any problem with the EMC SMI-S Provider will lead to further problems in the software solutions listed above, leading to a lack of monitoring that may go unnoticed until a failure happens in the storage systems.
Also, if a single EMC SMI-S Provider has been installed to cover a large storage infrastructure with tens of thousands of volumes, the EMC SMI-S Provider may be affected with performance issues and fail to respond to queries in a timely fashion, causing error messages and instability in the BMC and Sentry storage management solutions.
It is therefore crucial to continuously monitor the availability and performance of the EMC SMI-S Provider in order to detect problems in advance and quickly diagnose such problems.
Solution
Monitoring Studio KM for PATROL
Our solution relies on Monitoring Studio KM for PATROL, which is a configurable module for BMC PATROL and BMC ProactiveNet Performance Management (BPPM). Typically, a PATROL administrator will use Monitoring Studio KM’s GUI to “create” the monitoring of anything which the administrator doesn’t have a built-in KM for. The “setup” of the monitoring is stored in the PATROL Agent’s configuration.
More information about Monitoring Studio KM is available here.
Sentry has created a configuration template for Monitoring Studio KM to monitor the EMC SMI-S Provider. This article explains how to import this pre-built configuration and customize it to monitor the EMC SMI-S Provider, which is the technical prerequisite to monitor your EMC storage environment (Symmetrix, VMAX, CLARiiON and VNX arrays).
Monitored components
The solution monitors basic login page of ECOM, the ECOM log files, the availability and performance of the ECOM processes, dump files and the responsiveness to performance queries.
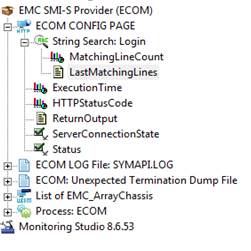
1/EMC ECOM Login Page
The first object monitors the login page of ECOM. It checks whether the credentials for logging into the administration page of ECOM through a Web Server are valid. If not, it alerts the user respectively according to the monitored parameter you can see below:
| Monitored Parameter | Monitored Parameter Output | Alert Condition |
| MatchingLineCount | 1.0 | WARN if <= 1 |
| LastMatchingLines | Login | N/A |
| ExecutionTime | 0.000 - 0.1000 | WARN if >= 10 seconds |
| HTTPStatusCode | 200 | 400, 410 |
| ReturnOutput | Welcome to the ECOM Administration | N/A |
| ServerConnectionState | 0 = OK | 1 = Server could not be reached |
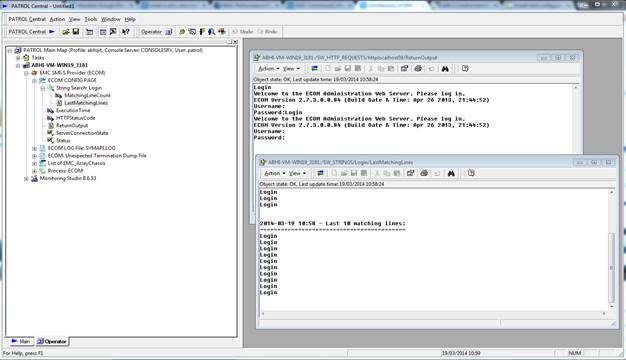
Figure 1 - Monitoring an ECOM (EMC SMI-S Provider) Login Page
2/Processes
Key performance metrics are constantly monitored for the ECOM processes. The processes related to ECOM are monitored as a whole and displayed as a single object in the console. This way the administrators can check the system resource consumption of the ECOM processes associated to the EMC SMI-S Agent.
Monitored processes:
For Windows: ECOM.exe
For Linux: ECOM (ECOM -d -c /opt/emc/ECIM/ECOM/conf)
For each of these processes, the following parameters are monitored:
- ChildCount
- Count
- ProcessorTime
- VirtualBytes
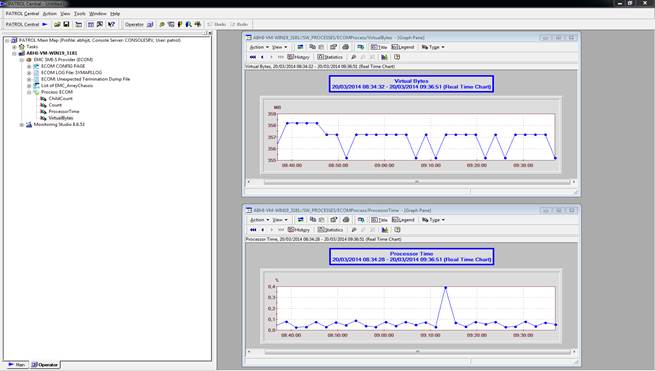
Figure 2 - ECOM Process Monitoring
By default, only the ProcessorTime parameter triggers a warning when it reaches 90% five times in a row and 99% twice in a row. These thresholds (like any alert threshold in Monitoring Studio) can be customized through the interface, by right-clicking the EMC SMI-S Provider (ECOM) icon > KM commands > Set thresholds:
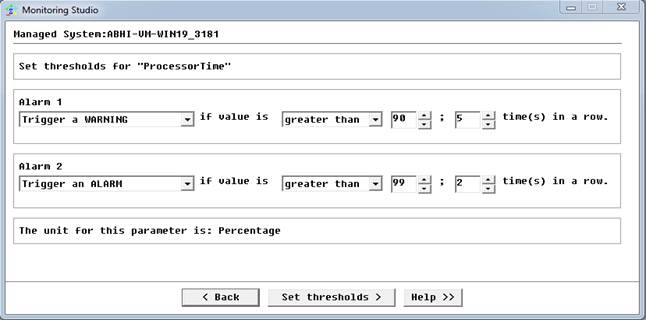
Figure 3- Setting Thresholds
3/ECOM Logs: SYMAPI.LOG
When the EMC SMI-S Provider encounters a problem, it reports it as an entry in the SYMAPI.log file. Monitoring Studio KM is used to continuously monitor this LOG file and triggers alerts as problems are reported in this file.
In the console, the MatchingLineCount parameter reports the number lines in the SYMAPI.log file that contain either “warning” or “error” since the last reset of the counter. For each new error detected, the MatchingLineCount parameter is increased by one. As the alarm threshold is set to 1 on this parameter, an alert is triggered in the PATROL Console as soon as something wrong is reported in the SYMAPI.LOG file. The MatchingLineCount keeps the same value until it is manually acknowledged and reset by an operator. This acknowledgment can be configured to happen automatically after a certain amount of time.
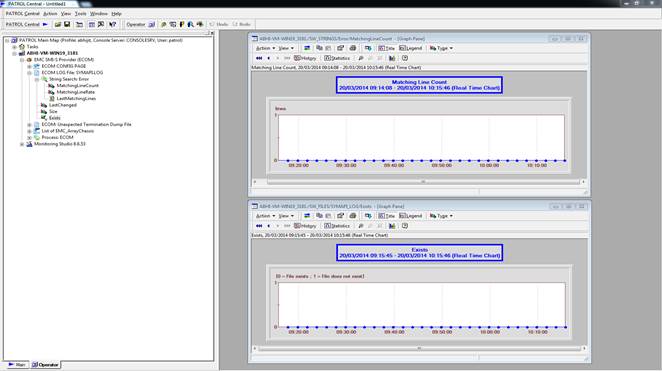
Figure 4- Monitoring SYMAPI.LOG file
When a new error is detected, a PATROL event is generated with an ALARM so that administrators can easily understand the origin of the problem and how to solve it.
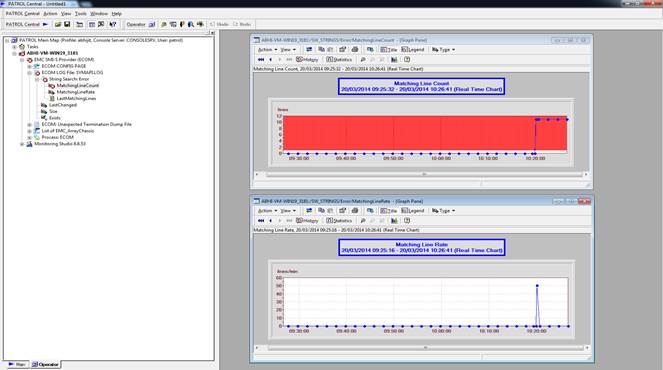
Figure 5- ALARM generation for detected error in SYMAPI.LOG
4/Array Counter for EMC Storage
We monitor the total number of EMC storage systems attached to the EMC SMI-S provider through a simple WBEM query. This is the first basic step to actually verify whether your EMC SMI-S provider is working properly and it sees all the different storage systems like Symmetrix or VNX in your EMC environment.
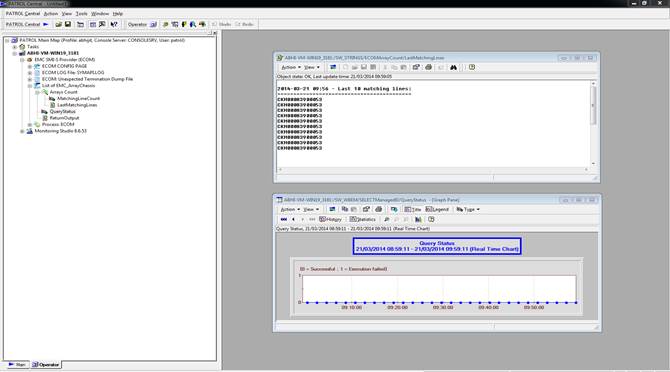
Figure 6- EMC Array Counters
Note: The WBEM query provided here is a basic one, only for monitoring total number of storage arrays and we invite you to modify the query according to your need in your EMC environment.
The monitored parameters and their corresponding output are listed in the table below:
| Monitored Parameter | Monitored Parameter Output | Alert Condition |
| MatchingLineCount | 1.0 - n lines | WARN if <= 1 |
| LastMatchingLines | EMC STORAGE ARRAY Serial Number | No Data |
| QueryStatus | 0 = Successful | 1 = Execution Failed |
| ReturnOutput | EMC STORAGE ARRAY Serial Number | No Data |
5/ECOM Dump File
Our configuration constantly monitors the existence of dump files of the EMC SMI-S provider so that administrators can get a hold of it in case of an issue related to the SMI-S agent. If an unexpected termination occurs, an ECOM.exe.dmp dump file is produced by default in the C:\Program Files\EMC\ECIM\ECOM\Providers directory on Windows systems, and a core file is produced in the /opt/emc/sympai directory on Linux systems.
Note: When such problem occurs, it is recommended to send this dump file along with the remaining contents of the log directory to EMC Customer Support for analysis.
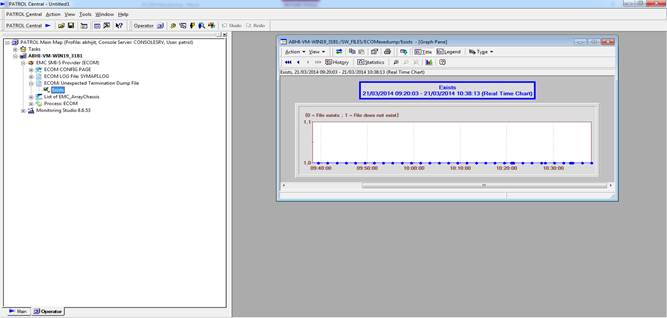
Figure 7- Monitoring of ECOM Unexpected Termination Dump File
Installation
Prerequisites
In order to setup the monitoring of ECOM via the template provided in this article, you will need to make sure the following items are available, installed and properly configured:
- A fully functional BMC PATROL environment (optionally part of a larger BPPM environment), with a BMC PATROL Console
- A PATROL Agent on the ECOM server or Remote server.
- Monitoring Studio KM for PATROL, installed on the agent on the ECOM Server or Remote Server, minimum version 8.6.53 for Windows and minimum version 8.6.54 for Linux.
- Monitoring Studio KM is properly loaded on the agent and in the console.
- The ECOM-MONITORING-TEMPLATE.cfg is installed in a folder on the PATROL Agent Server.
Procedure
- From the PATROL Console, [right-click] on the main “Monitoring Studio” icon > [KM Commands] > [Configuration] > [Import Configuration…]
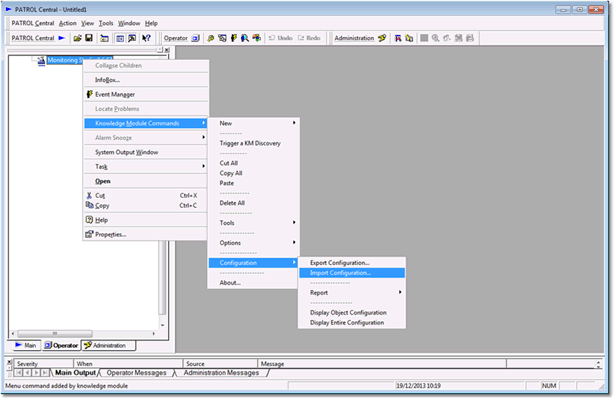
Figure 8- Import Configuration
- Enter the path of the folder where you have stored the ECOM-MONITORING-TEMPLATE.cfg (this path is on the agent, on the PATROL Agent Server):
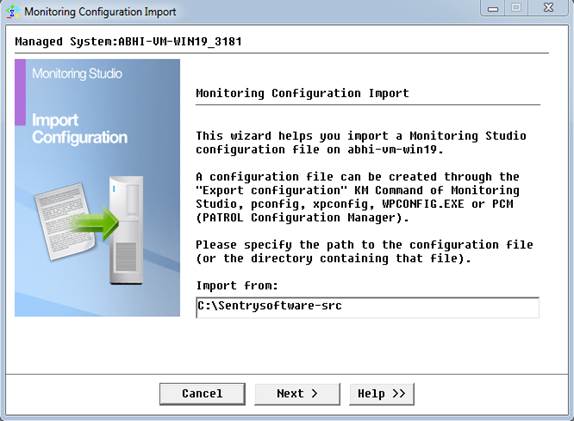
Figure 9- File Location
- Select the ECOM-MONITORING-TEMPLATE.cfg file in the list:
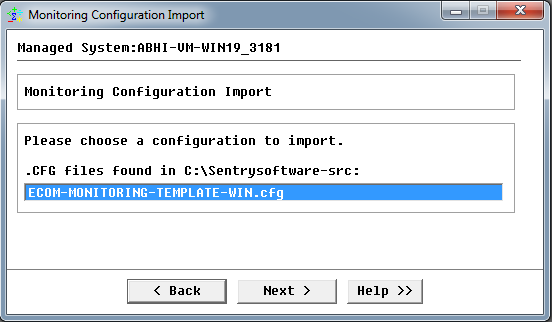
Figure 10- File Selection
- Monitoring Studio checks the content of the file. This process can take a few seconds. It also asks for setting the polling interval. You can leave it to default or set it accordingly.
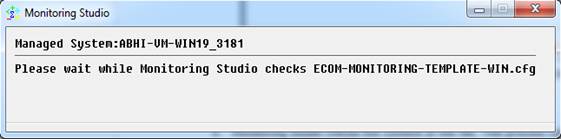
Figure 11- Importing

Figure 12- Setting the polling interval of common collectors
- Monitoring Studio then asks whether the default application constants should be cleared. If the default values happens to match with the values used in your EMC environment, then you can click on the [Keep values] button. Otherwise, click on the [Clear values].
Note: The password used over here for PASSWORD is the default password for the system account, which is #1Password
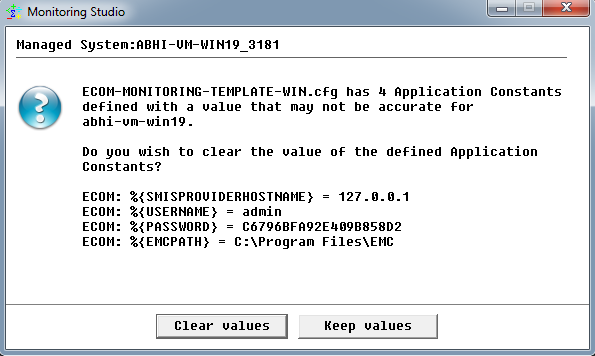
Figure 13- Application Constants
- Monitoring Studio is ready to import the configuration. Click [Finish] to start the import.
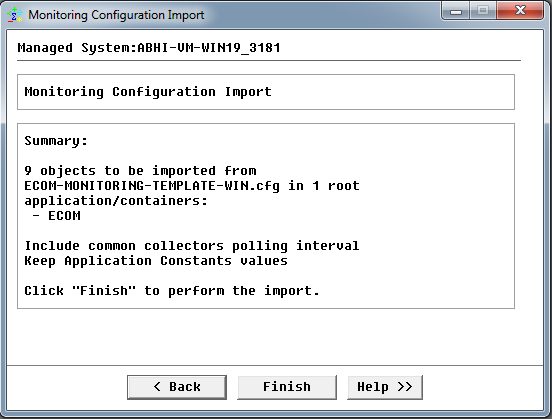
Figure 14- Summary
- The import process can take a few minutes:
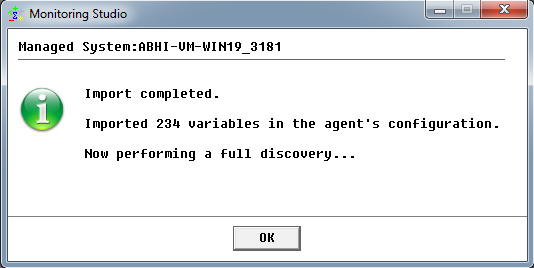
Figure 15- Importing
- After the import process completes, Monitoring Studio KM starts creating the icons corresponding to the monitored objects in the PATROL Console. If you chose to clear the application constants, all parameters are kept OFFLINE and the actual monitoring does not start until you enter a valid value for the application constant:

Figure 16- ECOM Monitoring in the PATROL Console
- To set the different application constants, [right-click] on the “EMC SMI-S Provider (ECOM)” icon in the PATROL Console > [KM Commands] > [Modify Application Constants…]
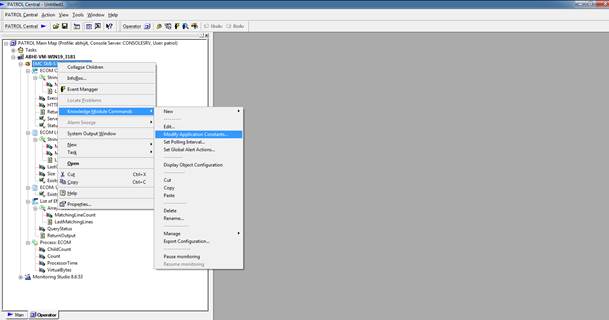
Figure 17- Modifying Application Constants
- Enter the corresponding constant values according to your EMC environment, and click [OK].
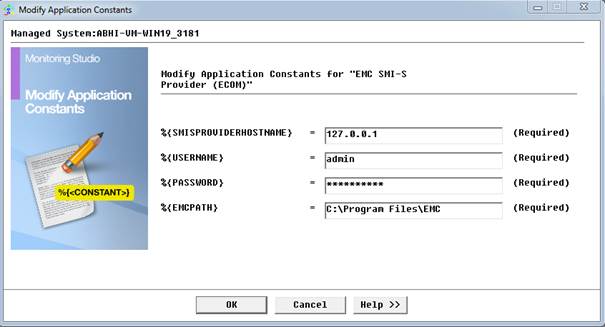
Figure 18- Application Constants Path
Monitoring Studio brings all the monitored objects ONLINE and the monitoring of SMI-S Provider of EMC starts effectively. The initialization of the monitoring can take a couple minutes to complete.
Alternate Installation Procedure
Alternatively, PATROL administrators can use WPCONFIG.EXE, pconfig or PCM (PATROL Configuration Manager) to deploy the ECOM-MONITORING-TEMPLATE.cfg configuration file. Once this is done, it is recommended to force a full discovery on the PATROL Agent to make sure Monitoring Studio KM takes into account the new configuration immediately (without waiting for the next discovery cycle, which occurs by default every hour).
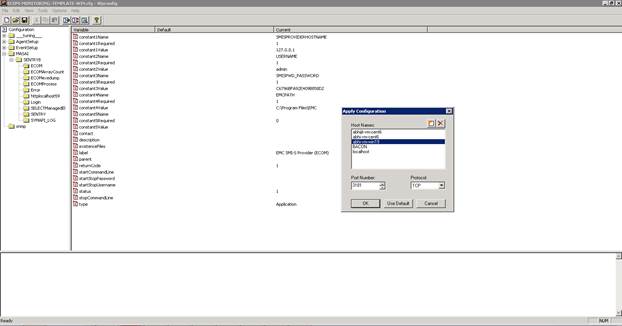
Figure 19- Deploying Configuration File Using wpconfig.exe
Editing the different application constants as described above is still required to make sure the monitoring is adapted to the environment. This can also be done by editing the different configuration variables under /MASAI/SENTRY8/ECOM/ before applying the configuration to the selected PATROL Agent.
Post-installation tasks
For Windows:
- From the PATROL Console, [right-click] on the main “Monitoring Studio” icon > [KM Commands] > [Options] > [Java Settings…]
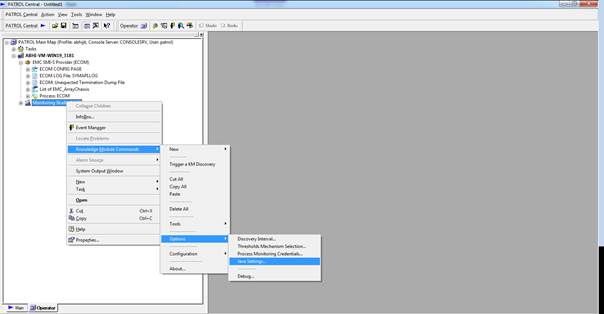
Figure 20- Java Settings
- Enter the path to Java on the PATROL Agent:
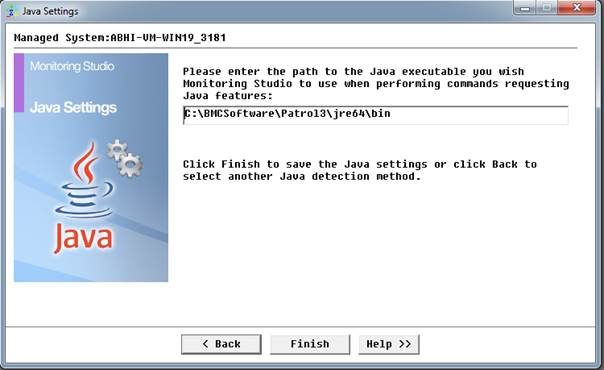
Figure 21- Java Path Location
For Linux:
- From the PATROL Console, [right-click] on the main “Monitoring Studio” icon > [KM Commands] > [Options] > [Java Setttings…]
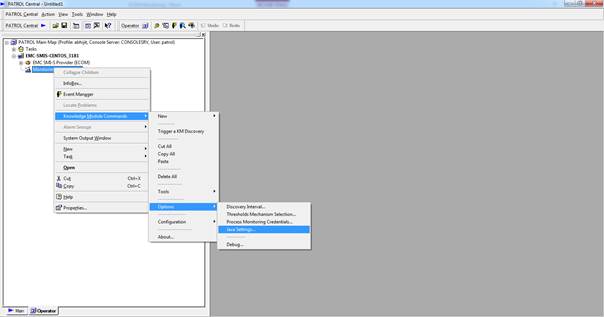
Figure 22- Java Settings
- Enter the path to Java on the PATROL Agent:
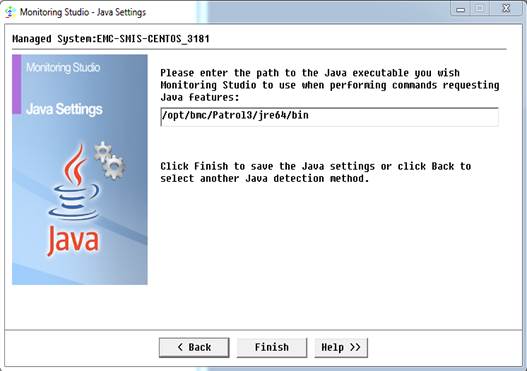
Figure 23 - Java Path Location
Once the above steps are complete, the monitoring shall start and all the metrics would be populated in your BMC environment.
Related Topics
- Monitoring EMC Data Domain Storage Devices with Monitoring Studio
- Monitoring EMC RecoverPoint Storage Devices with Monitoring Studio
- Monitoring EMC Atmos Storage Devices with Monitoring Studio
- Monitoring EMC Isilon Storage Devices with Monitoring Studio
- How to Rebuild the SYMAPI Database in the EMC SMI-S Provider