Objective
PostgreSQL database is natively supported by Monitoring Studio v. 8.6.54 and higher. If you are using an older version of Monitoring Studio, you can still perform DB queries on to this database through the ODBC connection method.
This document explains the procedure to configure the monitoring of PostgreSQL DB.
A pre-built configuration is available to monitor a PostgreSQL database running on Linux or Windows. Refer to KB1185 for more details
Pre-requisites
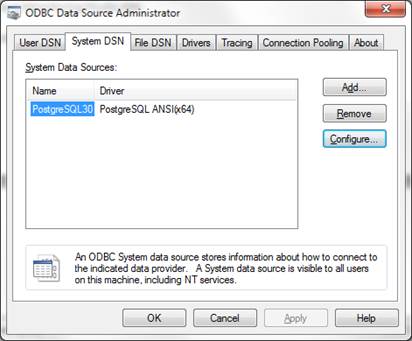
- Install PostgreSQL ANSI ODBC Driver and verify the connectivity with the help of ODBC Data Source Administrator (Windows only).
- The driver can be downloaded from: www.postgresql.org/ftp/odbc/versions/
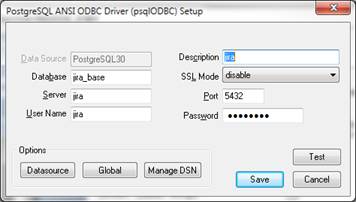
- Install the driver and configure it using ODBC Data Source Administrator.
Warning: Using UTF-8 encoding, will require an ODBC driver for Unicode, not ANSI.
- Click Save to validate your settings
- Click OK.
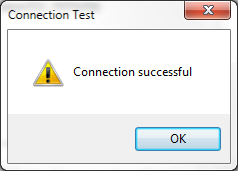
Once you succeed in establishing a connection, proceed with the steps to configure the Database Query Analysis feature in Monitoring Studio KM.
Configure the Database Query Analysis tool of Monitoring Studio KM for PATROL
- To create a new database query analysis, right-click the Application/Container icon in the PATROL Console and select KM Commands › New › Database Query analysis…
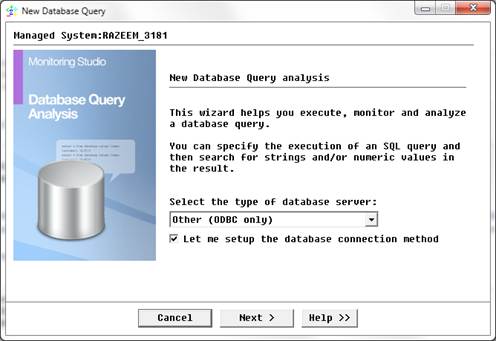
- Select the type of database server you need to query, that is Other (ODBC only).
- Check the Let me set up the database connection method option to select the connection method you wish to use to access the database. A list of available connection methods will be displayed in next wizard's panel.
- Click Next to continue.
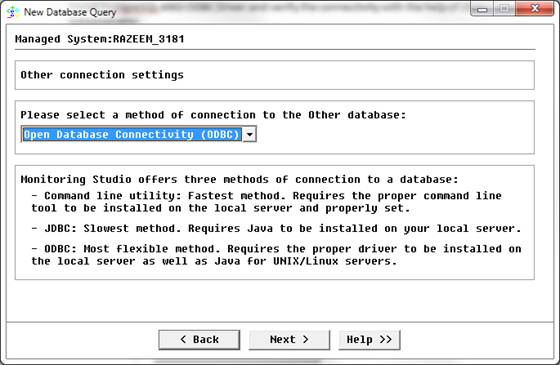
- Select the method of connection to the database you wish to use, that is Open Database Connectivity (ODBC).
- Click Next to continue.
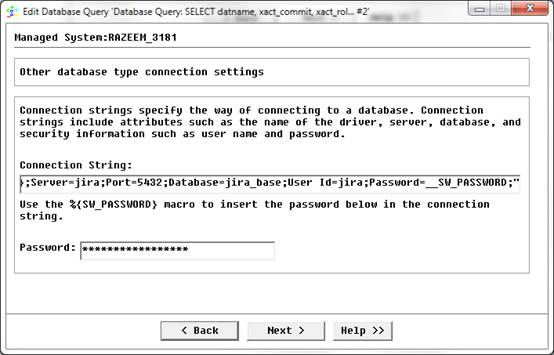
- Enter the connection string that includes attributes such as the name of the driver, server, database and security information (user name and password). The syntax of the connection string is:
x64 servers :
Driver={PostgreSQL ANSI(x64)};Server=‹server›Port=‹port number›;Database=‹database name›;User Id=‹user ID›;Password=%{SW_PASSWORD};For Example:
Driver={PostgreSQL ANSI(x64)};Server=jira;Port=5432;Database=jira_base;User Id=jira;Password=%{SW_PASSWORD};x86 servers:
Driver={PostgreSQL ANSI};Server=‹server›Port=‹port number›;Database=‹database name›;User Id=‹user ID›;Password=%{SW_PASSWORD}; - Click Next to open the query definition panel.
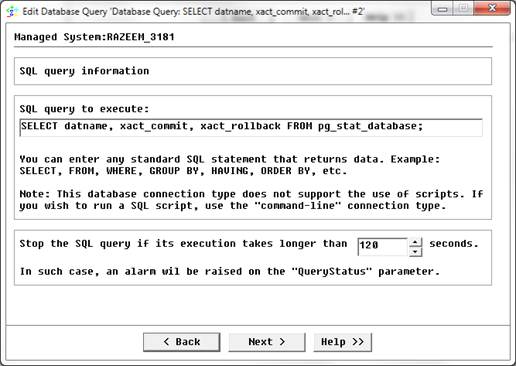
- Specify the query you wish to execute.
In the SQL Query to execute field, enter the single line SQL statement to be executed by the server. This can be also the path to an existing SQL script file.Use the following syntax if you want to execute the SQL query from a file: "@@ ‹file name›". Only supported with Command Line connection method.
- Set the Query timeout. When the execution exceeds the given timeout (in seconds), the ConnectionStatus parameter goes into alert.
- Clicking Next brings you to the last step of the wizard.
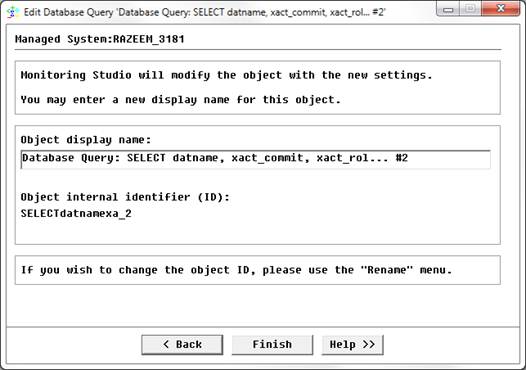
- The final step of the wizard allows you to enter information related to the query labeling and the threshold settings:
- Object display name: Label displayed in the PATROL Console
- Object internal identifier (ID): PATROL internal identifier of this monitored object
- Click Finish to complete the configuration. A new parameter corresponding to your query will automatically be displayed in the PATROL Console.