Downloads
69.1KB
Objective
Our goal is to monitor Microsoft Lync Server 2010 in BMC PATROL (and/or BMC TrueSight Operations Management) to detect failures, errors and performance problems.
This article only applies to the version 2010 of Microsoft Lync Server, but can certainly be adapted to earlier versions (like Microsoft OCS 2007 notably).
Solution
Installation
Solution
Monitoring Studio KM for PATROL
Our solution relies on Monitoring Studio KM for PATROL, which is a configurable module for BMC PATROL (and therefore BMC TrueSight Operations Management). Typically, a PATROL administrator will use Monitoring Studio KM’s GUI to “create” the monitoring of anything which the administrator does not have a built-in KM for. The “setup” of the monitoring is stored in the PATROL Agent’s configuration.
More information about Monitoring Studio KM is available here on Sentry’s Website.
Here, Sentry has already built a configuration for Monitoring Studio KM that “makes” it monitor Microsoft Lync Server 2010. This article simply explains how to import this pre-built configuration and customize it to monitor your Microsoft Lync environment.
Monitored components
The architecture of Microsoft Lync Server 2010 can be quite complex as it involves several systems with different roles, where each role runs different components of Lync Server: Archive Servers, Edge Servers, Quality Monitoring Servers, Microsoft SQL Server, etc.
Note: The solution described here does not cover Microsoft SQL Server or other non-Lync components that may participate in the architecture, like NLB, MSCS, etc. The user is invited to configure other KMs specific to these technologies, notably: BMC ProactiveNet Performance Management for Servers (for Microsoft Windows infrastructure, including Windows itself, MSCS, NLB, MSMQ, etc.) and BMC ProactiveNet Performance Management for Databases (for Microsoft SQL Server)
The solution monitors a mixture of Windows services, processes, Windows Event Logs and performance counters that are grouped based upon which component of Lync Server they relate to.
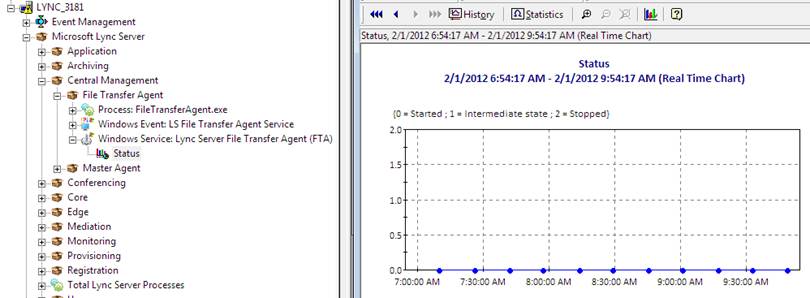
1/Windows services
The status of the services listed in the table below is monitored by the solution. Each service is represented with a separate object in the console. The “Status” parameter reports the status of the service. This parameter will trigger an alarm if the service is stopped and a warning if the service is in an intermediate state (stop pending, paused, etc.).
| Lync Component | Monitored Windows Service |
| LSAccess Edge | Lync Server Front-End (RTCSRV) |
| LSApplication Sharing | Lync Server Application Sharing (RTCASMCU) |
| LSArchiving | Lync Server Archiving (RTCLOG) |
| LSAudio Conferencing Provider | Lync Online Telephony Conferencing (RTCACPMCU) |
| LSAudio Video Authentication Edge | Lync Server Audio/Video Authentication (RTCMRAUTH) |
| LSAudio Video Conferencing | Lync Server Audio/Video Conferencing (RTCAVMCU) |
| LSAudio Video Edge | Lync Server Audio/Video Edge (RTCMEDIARELAY) |
| LSCall Announcement Service | Lync Server Conferencing Announcement (RTCCAS) |
| LSCall Details Reporting | Lync Server Call Detail Recording (RTCCDR) |
| LSCall Park Service | Lync Server Call Park (RTCCPS) |
| LSCentral Management File Transfer Agent | Lync Server File Transfer Agent (FTA) |
| LSCentral Management Master Agent | Lync Server Master Replicator Agent (MASTER) |
| LSConferencing Auto Attendant | Lync Server Conferencing Attendant (RTCCAA) |
| LSData Conferencing | Lync Server Data Conferencing (RTCDATAMCU) |
| LSInstant Message Conferencing | Lync Server IM Conferencing (RTCIMMCU) |
| LSMediation Server | Lync Server Mediation (RTCMEDSRV) |
| LSPolicy Decision Point | Lync Server Bandwidth Policy Service (Authentication) (RTCPDPAUTH) |
| LSPolicy Decision Point | Lync Server Bandwidth Policy Service (RTCPDPCORE) |
| LSProvisioning | Lync Online Provisioning Service (RtcProv) |
| LSQoE | Lync Server QoE Monitoring Service (RtcQms) |
| LSRegistrar | Lync Server Front-End (RTCSRV) |
| LSReplication Agent | Lync Server Replica Replicator Agent (REPLICA) |
| LSResponse Group | Lync Server Response Group (RTCRGS) |
| LSUser Service | Lync Server Front-End (RTCSRV) |
| LSWeb Conferencing Edge | Lync Server Web Conferencing Edge (RTCDATAPROXY) |
| LSWeb Service | World Wide Web Publishing Service (w3svc) |
2/Processes
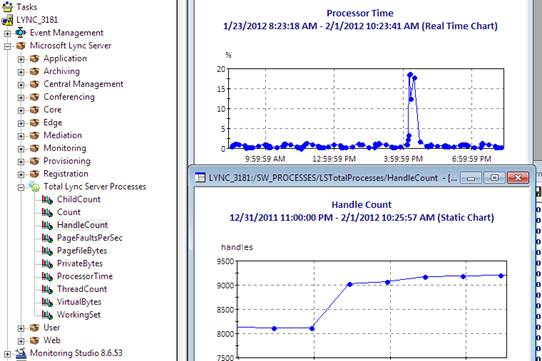
Key performance metrics are constantly monitored for all of the Lync Server processes. Each process is monitored independently and displayed as a separate object in the console. The sum of all of these processes is available as a separate object as well so administrators can check the system resource consumption of Lync Server in general, and of each process individually.
Monitored processes:
- Process: ASMCUSvc.exe
- Process: AVMCUSvc.exe
- Process: DataMCUSvc.exe
- Process: FileTransferAgent.exe
- Process: IMMCUSvc.exe
- Process: MasterReplicatorAgent.exe
- Process: MeetingMCUSvc.exe
- Process: OcsAppServerHost.exe RTCATS
- Process: QoEAgent.exe
- Process: ReplicaReplicatorAgent.exe
- Process: RTCSrv.exe
- Process: w3wp.exe
- Total Lync Server Processes (all processes that have %{PATH} in their path)
For each of these processes, the following parameters are monitored:
- HandleCount
- PageFaultsPerSec
- PagefileBytes
- PrivateBytes
- ProcessorTime
- ThreadCount
- VirtualBytes
- WorkingSet
Example of process monitoring:
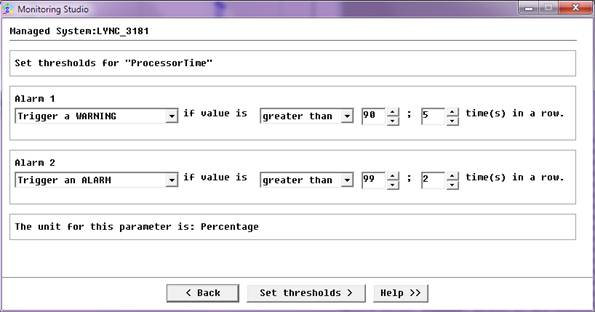
By default, only the ProcessorTime parameter triggers a warning when it reaches 90% five times in a row and 99% twice in a row. These thresholds (like any alert threshold in Monitoring Studio) can be customized through the GUI:
3/Windows Event Logs
When Microsoft Lync Server encounters a problem, it reports it as an event in the Windows Event Log dedicated to Microsoft Lync. These events are constantly monitored by the solution and any “warning” or “error” event related to Lync in the Windows Event Log will be reported in the console.
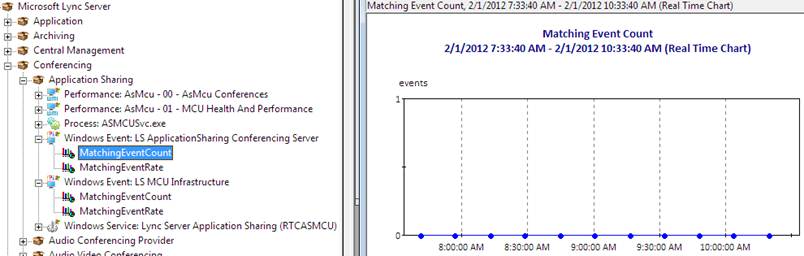
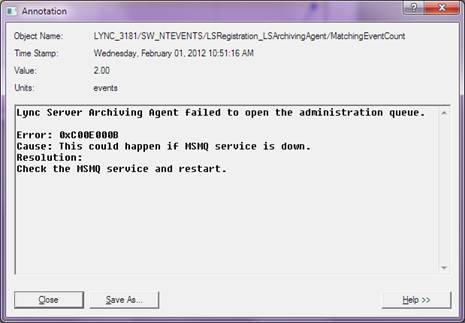
Each Event Log Source is represented with a separate icon in the console. For each instance, the MatchingEventCount parameter reports the number of warning and error events since the last reset of the counter. For each new event, the MatchingEventCount parameter is increased by one. As the alarm threshold is set to 1 on this parameter, an alert is triggered in the PATROL Console as soon as something wrong happens with Microsoft Lync. The MatchingEventCount keeps the same value until it is manually acknowledged and reset by an operator. This acknowledgment can be configured to happen automatically after a certain amount of time.
Example of a Windows Event Log monitoring:
When a new event is detected, a PATROL event is generated with the exact content of the Windows event so that administrators can easily understand what is wrong and how to solve the problem (the content of the events for Microsoft Lync are notably detailed and provide much information on how to diagnose and troubleshoot the problem). An annotation point is also added to the graph of the MatchingEventCount parameter.
The Windows Event Log sources that are monitored for Microsoft Lync Server are:
- LS A/V Edge Server
- LS ACP MCU
- LS Address Book and Distribution List Expansion Web Service
- LS Address Book Server
- LS AppDomain Host Process
- LS Application Error
- LS Application Server
- LS Applications Module
- LS ApplicationSharing Conferencing Server
- LS Archiving Agent
- LS Archiving Server
- LS Audio-Video Conferencing Server
- LS Audio/Video Authentication Server
- LS Auto Update Server
- LS Bandwidth Policy Service (Authentication)
- LS Bandwidth Policy Service (Core)
- LS Call Detail Recording
- LS Call Park Service
- LS Certificate Manager
- LS Client Version Filter
- LS Common Library
- LS Conferencing Announcement Service
- LS Conferencing Attendant
- LS Configuration Provider
- LS Data MCU
- LS DB Access Layer
- LS Dialin Web Service
- LS Exchange Unified Messaging Routing
- LS File Transfer Agent Service
- LS IM MCU
- LS Inbound Routing
- LS Incoming Federation Service
- LS Intelligent IM Filter
- LS InterCluster Routing
- LS Join Launcher Web Service
- LS LDM
- LS Location Information Service
- LS Lync Web App
- LS Master Replicator Agent Service
- LS MCU Factory
- LS MCU Infrastructure
- LS Mediation Server
- LS Meeting MCU
- LS MGC ADMIN TOOL
- LS MGC CLIENT
- LS MGC COMMON
- LS MGC COMPLIANCE
- LS MGC CONFIG
- LS MGC ENDPOINT
- LS MGC LOADER
- LS MGC LOOKUP
- LS MGC SERVER
- LS MGC SERVICE
- LS MGC TRANSPORT
- LS Outbound Routing
- LS Outgoing Federation Service
- LS Password Expiry Check
- LS Protocol Stack
- LS Provisioning Service
- LS QoE Monitoring Agent
- LS QoE Monitoring Service
- LS Remote PowerShell
- LS Replica Replicator Agent Service
- LS Response Group Service
- LS Routing Data Sync Agent
- LS Script-Only Applications
- LS Server
- LS Software Update Service
- LS Translation Service
- LS User Replicator
- LS User Services
- LS UserPin Service
- LS Web Components Server
- LS Web Conferencing Edge Server
4/Performance Counters
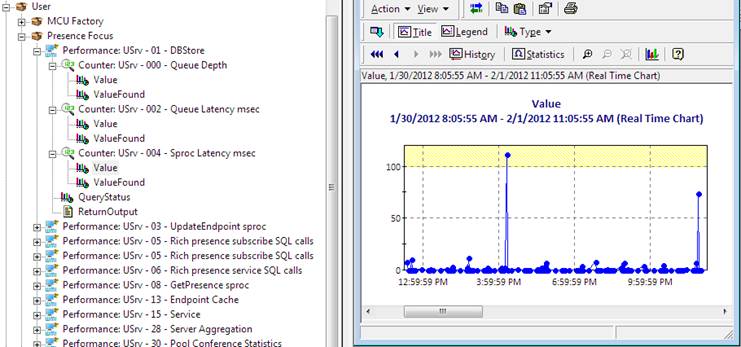
Many performance counters are monitored constantly to report the activity of Microsoft Lync Server and detect potential performance bottlenecks. Each performance counter is represented as a separate instance in the PATROL Console, grouped by the class of the corresponding Windows performance object. Depending on their nature, the performance counter instances may have one or several monitored parameters:
- Value (representing the raw value of the Windows counter)
- Delta (representing the difference of the counter value between two pollings)
- DeltaPerSecond (representing the difference rate of the counter value between two pollings, typically used for bytes/sec or messages/sec counters)
Example of performance monitoring:
The list of monitored performance counters is summarized in the table below:
| Lync Component | Performance Object Name | Counter Name |
| LSAccess Edge | LS:SIP - 00 - Networking | SIP - 006 - Connections Refused Due To Server Overload |
| LS:SIP - 01 - Peers | SIP - 017 - Sends Outstanding | |
| LS:SIP - 01 - Peers | SIP - 020 - Average Outgoing Queue Delay | |
| LS:SIP - 02 - Protocol | SIP - 012 - Messages In Server | |
| LS:SIP - 02 - Protocol | SIP - 021 - Average Incoming Message Processing Time | |
| LS:SIP - 04 - Responses | SIP - 053 - Local 500 Responses/sec | |
| LS:SIP - 04 - Responses | SIP - 055 - Local 503 Responses/sec | |
| LS:SIP - 07 - Load Management | SIP - 000 - Average Holding Time For Incoming Messages | |
| LS:SIP - 07 - Load Management | SIP - 006 - Incoming Messages Timed out | |
| LS:SIP - 07 - Load Management | SIP - 009 - Address space usage | |
| LS:SIP - 08 - Access Edge Server Connections | SIP - 015 - Rejected External Edge Client Connections/sec | |
| LS:SIP - 09 - Access Edge Server Messages | SIP - 025 - Messages/sec Dropped Due To Unknown Domain | |
| LS:SIP - 09 - Access Edge Server Messages | SIP - 063 - External Messages/sec Dropped Due To Unresolved Domain | |
| LSAddress Book File Handler | LS:WEB - 01 - Address Book File Download | WEB - 001 - Succeeded File Requests/Second |
| LS:WEB - 01 - Address Book File Download | WEB - 002 - Average processing time for a succeeded file request in milliseconds | |
| LS:WEB - 01 - Address Book File Download | WEB - 005 - Failed File Requests/Second | |
| LSAddress Book Query | LS:WEB - 02 - Address Book Web Query | WEB - 003 - Successful search requests/sec |
| LS:WEB - 02 - Address Book Web Query | WEB - 005 - Failed search requests/sec | |
| LS:WEB - 02 - Address Book Web Query | WEB - 006 - Average processing time for a search request in milliseconds | |
| LS:WEB - 02 - Address Book Web Query | WEB - 009 - Average processing time for a address book database query in milliseconds | |
| LSApplication Sharing | LS:AsMcu - 00 - AsMcu Conferences | ASMCU - 000 - Active Conferences |
| LS:AsMcu - 00 - AsMcu Conferences | ASMCU - 001 - Active Transcoders | |
| LS:AsMcu - 00 - AsMcu Conferences | ASMCU - 002 - Active Data Channels | |
| LS:AsMcu - 00 - AsMcu Conferences | ASMCU - 003 - Connected Users | |
| LS:AsMcu - 00 - AsMcu Conferences | ASMCU - 006 - Active Ajax Viewers | |
| LS:AsMcu - 00 - AsMcu Conferences | ASMCU - 029 - Media Timeout Failures | |
| LS:AsMcu - 00 - AsMcu Conferences | ASMCU - 030 - Packet Loss Failure | |
| LS:AsMcu - 00 - AsMcu Conferences | ASMCU - 031 - Sip Dialog Failures | |
| LS:AsMcu - 00 - AsMcu Conferences | ASMCU - 032 - Rdp Connection Timeout Failures | |
| LS:AsMcu - 01 - MCU Health And Performance | ASMCU - 005 - MCU Health State | |
| LSArchiving | LS:Arch Service - 01 - READ | Arch Service - 001 - Messages/sec successfully parsed |
| LS:Arch Service - 01 - READ | Arch Service - 002 - Messages that failed validation | |
| LS:Arch Service - 01 - READ | Arch Service - 003 - Messages/sec that failed validation | |
| LS:Arch Service - 01 - READ | Arch Service - 005 - Bytes/sec read from MQ | |
| LS:Arch Service - 01 - READ | Arch Service - 006 - Dropped messages from MQ | |
| LS:Arch Service - 01 - READ | Arch Service - 007 - Dropped messages/sec from MQ | |
| LS:Arch Service - 01 - READ | Arch Service - 009 - Transactions committed/sec | |
| LS:Arch Service - 01 - READ | Arch Service - 011 - Transactions aborted/sec | |
| LS:Arch Service - 02 - WRITE | Arch Service - 001 - Messages/sec written to DB | |
| LS:Arch Service - 02 - WRITE | Arch Service - 002 - Messages failed to be written to DB | |
| LS:Arch Service - 02 - WRITE | Arch Service - 003 - Messages/sec failed to be written to DB | |
| LSAudio Video Authentication Edge | LS:A/V Auth - 00 - Requests | - 001 - Credentials Issued/sec |
| LS:A/V Auth - 00 - Requests | - 003 - Bad Requests Received/sec | |
| LS:A/V Auth - 00 - Requests | - 004 - Current requests serviced | |
| LSAudio Video Conferencing | LS:AVMCU - 00 - Operations | AVMCU - 000 - Number of Conferences |
| LS:AVMCU - 00 - Operations | AVMCU - 001 - Number of Users | |
| LS:AVMCU - 00 - Operations | AVMCU - 002 - Number of Trusted Users | |
| LS:AVMCU - 02 - Informational | AVMCU - 011 - Total MRAS Request | |
| LS:AVMCU - 02 - Informational | AVMCU - 012 - Total MRAS Request error | |
| LS:AVMCU - 02 - Informational | AVMCU - 014 - Total MRAS Requests Rejected | |
| LS:AVMCU - 02 - Informational | AVMCU - 015 - Total MRAS Timeout Exceptions | |
| LS:AVMCU - 02 - Informational | AVMCU - 016 - Total MRAS Failure Response Exceptions | |
| LS:AVMCU - 02 - Informational | AVMCU - 017 - Total MRAS Real Time Exceptions | |
| LS:AVMCU - 02 - Informational | AVMCU - 018 - Total MRAS Generic Exceptions | |
| LS:MEDIA - 01 - Planning | MEDIA - 009 - Number of occasions conference processing is delayed significantly | |
| LS:SipEps - 02 - SipEps Connections | SipEps - 010 - NumberOfDNSResolutionFailures | |
| LSAudio Video Edge | LS:A/V Edge - 00 - UDP Counters | A/V Edge - 001 - Active Relay Sessions - Authenticated |
| LS:A/V Edge - 00 - UDP Counters | A/V Edge - 008 - Authentication Failures/sec | |
| LS:A/V Edge - 00 - UDP Counters | A/V Edge - 010 - Allocate Requests Exceeding Port Limit/sec | |
| LS:A/V Edge - 00 - UDP Counters | A/V Edge - 029 - Packets Dropped/sec | |
| LS:A/V Edge - 00 - UDP Counters | A/V Edge - 034 - Active Sessions Exceeding Avg Bandwidth Limit | |
| LS:A/V Edge - 00 - UDP Counters | A/V Edge - 035 - Active Sessions Exceeding Peak Bandwidth Limit | |
| LS:A/V Edge - 01 - TCP Counters | A/V Edge - 001 - Active Relay Sessions - Authenticated | |
| LS:A/V Edge - 01 - TCP Counters | A/V Edge - 008 - Authentication Failures/sec | |
| LS:A/V Edge - 01 - TCP Counters | A/V Edge - 010 - Allocate Requests Exceeding Port Limit/sec | |
| LS:A/V Edge - 01 - TCP Counters | A/V Edge - 030 - Packets Dropped/sec | |
| LS:A/V Edge - 01 - TCP Counters | A/V Edge - 035 - Active Sessions Exceeding Avg Bandwidth Limit | |
| LS:A/V Edge - 01 - TCP Counters | A/V Edge - 036 - Active Sessions Exceeding Peak Bandwidth Limit | |
| LSCall Announcement Service | LS:CAS - 01 - Informational | CAS - 001 - Number of conferences joined |
| LSCall Details Reporting | LS:CDR Service - 01 - READ | CDR Service - 001 - Messages/sec successfully parsed |
| LS:CDR Service - 01 - READ | CDR Service - 002 - Messages that failed validation | |
| LS:CDR Service - 01 - READ | CDR Service - 003 - Messages/sec that failed validation | |
| LS:CDR Service - 01 - READ | CDR Service - 005 - Bytes/sec read from MQ | |
| LS:CDR Service - 01 - READ | CDR Service - 006 - Dropped messages from MQ | |
| LS:CDR Service - 01 - READ | CDR Service - 007 - Dropped messages/sec from MQ | |
| LS:CDR Service - 01 - READ | CDR Service - 009 - Transactions committed/sec | |
| LS:CDR Service - 01 - READ | CDR Service - 011 - Transactions aborted/sec | |
| LS:CDR Service - 02 - WRITE | CDR Service - 001 - Messages/sec written to DB | |
| LS:CDR Service - 02 - WRITE | CDR Service - 002 - Messages failed to be written to DB | |
| LS:CDR Service - 02 - WRITE | CDR Service - 003 - Messages/sec failed to be written to DB | |
| LSCall Park Service | LS:CPS - 01 - Call Park Service Planning | CPS - 011 - Current parked calls. |
| LS:CPS - 01 - Call Park Service Planning | CPS - 012 - Total park requests that failed. | |
| LS:CPS - 01 - Call Park Service Planning | CPS - 013 - Total park requests failed because unavailable orbit. | |
| LS:CPS - 01 - Call Park Service Planning | CPS - 017 - Total failed fallback attempts. | |
| LSCommunicator Web App | LS:WebRelay - 00 - Reach Web Relay Server | WEBRELAY - 000 - Active Sip Connections |
| LS:WebRelay - 00 - Reach Web Relay Server | WEBRELAY - 001 - Active Sip Connections for anonymous users | |
| LS:WebRelay - 00 - Reach Web Relay Server | WEBRELAY - 002 - Active Sip Connections for authenticated users | |
| LS:WebRelay - 00 - Reach Web Relay Server | WEBRELAY - 007 - Sip Connection Failures per second. | |
| LS:WebRelay - 00 - Reach Web Relay Server | WEBRELAY - 016 - Active AppShare Connections | |
| LS:WebRelay - 00 - Reach Web Relay Server | WEBRELAY - 017 - Active AppShare Connections for anonymous users | |
| LS:WebRelay - 00 - Reach Web Relay Server | WEBRELAY - 018 - Active AppShare Connections for authenticated users | |
| LS:WebRelay - 00 - Reach Web Relay Server | WEBRELAY - 020 - Active Data Collaboration Connections from clients | |
| LS:WebRelay - 00 - Reach Web Relay Server | WEBRELAY - 022 - Number of Data Collaboration client connections closed due to throttling. | |
| LS:WebRelay - 00 - Reach Web Relay Server | WEBRELAY - 023 - Number of Data Collaboration client connections closed due to throttling per second. | |
| LS:WebRelay - 00 - Reach Web Relay Server | WEBRELAY - 025 - Number of failed Data Collaboration authentication request per second. | |
| LS:WebRelay - 00 - Reach Web Relay Server | WEBRELAY - 031 - Number of Data Collaboration connection failures with Data Collaboration servers. | |
| LS:WebRelay - 00 - Reach Web Relay Server | WEBRELAY - 035 - Total number of queued bytes for Data Collaboration Server Connections. | |
| LSConferencing Auto Attendant | LS:CAA - 00 - Operations | CAA - 000 - Incomplete calls per sec |
| LS:CAA - 01 - Planning | CAA - 000 - Total incomplete calls | |
| LS:CAA - 01 - Planning | CAA - 002 - Current calls | |
| LS:CAA - 01 - Planning | CAA - 004 - Total calls failed to transfer to the conference | |
| LS:CAA - 01 - Planning | CAA - 012 - Total bandwidth failures | |
| LS:CAA - 01 - Planning | CAA - 044 - Total calls user failed to enter conference id correctly three times | |
| LS:CAA - 01 - Planning | CAA - 046 - Total Application Endpoint creation failures | |
| LS:CAA - 01 - Planning | CAA - 047 - Total Application Endpoint termination failures | |
| LS:CAA - 01 - Planning | CAA - 048 - Number of times retry logic was triggered | |
| LS:CAA - 01 - Planning | CAA - 049 - Number of times retry logic was successful | |
| LSData Conferencing | LS:DATAMCU - 00 - DataMCU Conferences | DATAMCU - 000 - Blocked files |
| LS:DATAMCU - 00 - DataMCU Conferences | DATAMCU - 003 - Active Conferences | |
| LS:DATAMCU - 00 - DataMCU Conferences | DATAMCU - 005 - Number of Unhandled Application Exception | |
| LS:DATAMCU - 00 - DataMCU Conferences | DATAMCU - 007 - Conference workitems load | |
| LS:DATAMCU - 00 - DataMCU Conferences | DATAMCU - 008 - Session queues state | |
| LS:DATAMCU - 00 - DataMCU Conferences | DATAMCU - 014 - Average time queued in data Mcu for LDM messages | |
| LS:DATAMCU - 00 - DataMCU Conferences | DATAMCU - 020 - Total data archiving events recorded. | |
| LSDevice Update Server | LS:WEB - 07 - Device Update | WEB - 001 - Total Update Requests |
| LS:WEB - 07 - Device Update | WEB - 003 - Total Log Upload Attempts | |
| LSExpand Distribution List | LS:WEB - 00 - Distribution List Expansion | WEB - 001 - Valid User Requests/sec |
| LS:WEB - 00 - Distribution List Expansion | WEB - 002 - Successful Request Processing Time | |
| LS:WEB - 00 - Distribution List Expansion | WEB - 005 - Average Active Directory Fetch time in milliseconds | |
| LS:WEB - 00 - Distribution List Expansion | WEB - 008 - Average member properties fetch time in milliseconds | |
| LS:WEB - 00 - Distribution List Expansion | WEB - 011 - Timed out Active Directory Requests/sec | |
| LS:WEB - 00 - Distribution List Expansion | WEB - 013 - Timed out Requests that fetch member properties/sec | |
| LS:WEB - 00 - Distribution List Expansion | WEB - 015 - Soap exceptions/sec | |
| LSInstant Message Conferencing | LS:ImMcu - 00 - IMMcu Conferences | IMMCU - 000 - Active Conferences |
| LS:ImMcu - 00 - IMMcu Conferences | IMMCU - 001 - Connected Users | |
| LS:ImMcu - 00 - IMMcu Conferences | IMMCU - 020 - Throttled Sip Connections | |
| LS:ImMcu - 02 - MCU Health And Performance | IMMCU - 005 - MCU Health State | |
| LSJoin Launcher | LS:JoinLauncher - 00 - Join Launcher Service | JOINLAUNCHER - 000 - Incoming join requests |
| LS:JoinLauncher - 00 - Join Launcher Service | JOINLAUNCHER - 001 - Join failures | |
| LS:JoinLauncher - 00 - Join Launcher Service | JOINLAUNCHER - 002 - Join successes | |
| LS:JoinLauncher - 00 - Join Launcher Service | JOINLAUNCHER - 003 - Join failures due to failure to lookup Base URL from SQUID | |
| LS:JoinLauncher - 00 - Join Launcher Service | JOINLAUNCHER - 004 - Join failures due to Lookup User failure | |
| LSMCU Factory | LS:MCUF - 00 - MCU Factory | MCUF - 000 - Total GetMCU Requests Received |
| LS:MCUF - 00 - MCU Factory | MCUF - 001 - Total GetMCU Requests Failed | |
| LS:MCUF - 00 - MCU Factory | MCUF - 002 - Total empty GetMCU Responses | |
| LS:MCUF - 00 - MCU Factory | MCUF - 003 - GetMCU Requests Received/sec | |
| LS:MCUF - 00 - MCU Factory | MCUF - 004 - Total Health Notifications Received | |
| LS:MCUF - 00 - MCU Factory | MCUF - 005 - Total Health Notifications Failed | |
| LS:MCUF - 00 - MCU Factory | MCUF - 006 - Health Notifications Received/sec | |
| LS:MCUF - 00 - MCU Factory | MCUF - 007 - Total Drain Requests Received | |
| LSMediation Server | LS:MediationServer - 00 - Outbound Calls | - 000 - Current |
| LS:MediationServer - 00 - Outbound Calls | - 001 - Total established | |
| LS:MediationServer - 00 - Outbound Calls | - 002 - Total attempts | |
| LS:MediationServer - 00 - Outbound Calls | - 003 - Total rejected due to load | |
| LS:MediationServer - 01 - Inbound Calls | - 000 - Current | |
| LS:MediationServer - 01 - Inbound Calls | - 001 - Total established | |
| LS:MediationServer - 01 - Inbound Calls | - 002 - Total attempts | |
| LS:MediationServer - 01 - Inbound Calls | - 003 - Total rejected due to load | |
| LS:MediationServer - 02 - Media Relay | - 001 - Media Connectivity Check Failure | |
| LS:MediationServer - 03 - Health Indices | - 000 - Load Call Failure Index | |
| LS:MediationServer - 04 - Global Counters | - 001 - Total failed calls caused by unexpected interaction from the Proxy | |
| LS:MediationServer - 05 - Global Per Gateway Counters | - 000 - Total failed calls caused by unexpected interaction from a gateway | |
| LSPolicy Decision Point | LS:A/V Auth - 00 - Requests | - 001 - Credentials Issued/sec |
| LS:A/V Auth - 00 - Requests | - 003 - Bad Requests Received/sec | |
| LS:A/V Auth - 00 - Requests | - 004 - Current requests serviced | |
| LS:PDP - 00 - Core - Total | PDP - 002 - BW Check Requests with Unsupported Modality | |
| LS:PDP - 00 - Core - Total | PDP - 004 - Failed BW Check Requests | |
| LS:PDP - 00 - Core - Total | PDP - 008 - BW Commit Requests with Unsupported Modality | |
| LS:PDP - 00 - Core - Total | PDP - 012 - Failed BW Update Requests | |
| LS:PDP - 00 - Core - Total | PDP - 016 - Active BW Reservations | |
| LS:PDP - 00 - Core - Total | PDP - 017 - Congested Links | |
| LS:PDP - 00 - Core - Total | PDP - 018 - Timed-out BW Reservations | |
| LS:PDP - 00 - Core - Total | PDP - 020 - Local BW Commit Requests Not Managed | |
| LS:PDP - 00 - Core - Total | PDP - 022 - BW Commit Requests Not Managed [IP Address Not Found] | |
| LS:PDP - 03 - TURN | PDP - 000 - Active client connections | |
| LS:PDP - 03 - TURN | PDP - 010 - Client Authentication timeout failures/sec | |
| LS:PDP - 03 - TURN | PDP - 016 - First packet timeouts/sec | |
| LS:PDP - 03 - TURN | PDP - 018 - Active edge connections | |
| LS:PDP - 03 - TURN | PDP - 022 - server authentication timeout failures/sec | |
| LS:PDP - 04 - Diagnostics | PDP - 002 - Messages dropped/sec | |
| LS:PDP - 04 - Diagnostics | PDP - 003 - Average task processing time (milliseconds) | |
| LSPresence Focus | LS:USrv - 01 - DBStore | USrv - 000 - Queue Depth |
| LS:USrv - 01 - DBStore | USrv - 002 - Queue Latency (msec) | |
| LS:USrv - 01 - DBStore | USrv - 004 - Sproc Latency (msec) | |
| LS:USrv - 03 - UpdateEndpoint sproc | USrv - 000 - Sproc calls/Sec | |
| LS:USrv - 05 - Rich presence subscribe SQL calls | USrv - 000 - RtcBatchSubscribeCategoryList Sproc calls/Sec | |
| LS:USrv - 05 - Rich presence subscribe SQL calls | USrv - 006 - Average number of users per subscribe request | |
| LS:USrv - 05 - Rich presence subscribe SQL calls | USrv - 008 - RtcSubscribeSelf Sproc calls/Sec | |
| LS:USrv - 05 - Rich presence subscribe SQL calls | USrv - 030 - RtcBatchQueryCategories Sproc calls/Sec | |
| LS:USrv - 06 - Rich presence service SQL calls | USrv - 000 - RtcPublishMultipleCategories Sproc calls/Sec | |
| LS:USrv - 08 - GetPresence sproc | USrv - 000 - Sproc calls/Sec | |
| LS:USrv - 13 - Endpoint Cache | USrv - 001 - Active Registered Endpoints | |
| LS:USrv - 15 - Service | USrv - 027 - MWI NOTIFYs received/Sec | |
| LS:USrv - 28 - Server Aggregation | USrv - 001 - Number of aggregation requests/second | |
| LS:USrv - 30 - Pool Conference Statistics | USrv - 000 - Conference Count | |
| LS:USrv - 30 - Pool Conference Statistics | USrv - 001 - Active Conference Count | |
| LS:USrv - 30 - Pool Conference Statistics | USrv - 002 - Active Participant Count | |
| LS:USrv - 30 - Pool Conference Statistics | USrv - 003 - Active Focus Endpoint Count | |
| LS:USrv - 30 - Pool Conference Statistics | USrv - 004 - Active Mcu Session Count | |
| LSProvisioning | LS:Provision - 00 - Provision | - 006 - Failed publish calls |
| LS:Provision - 00 - Provision | - 015 - Provision failures | |
| LSQoE | LS:QMS - 00 - QoEMonitoringServer | QMS - 001 - Number of message transactions completed per second |
| LS:QMS - 00 - QoEMonitoringServer | QMS - 002 - Total number of message transactions that failed | |
| LS:QMS - 00 - QoEMonitoringServer | QMS - 003 - Total number of reports that were dropped due to database insertion failure | |
| LSRegistrar | LS:Arch Agent - 00 - MSMQ | Arch Agent - 001 - Archiving Messages/sec |
| LS:Arch Agent - 00 - MSMQ | Arch Agent - 003 - Archiving Message bytes/sec | |
| LS:Arch Agent - 00 - MSMQ | Arch Agent - 005 - Call Details Recording Messages/sec | |
| LS:Arch Agent - 00 - MSMQ | Arch Agent - 007 - Call Details Recording Message bytes/sec | |
| LS:QMSAgent - 00 - QoEMonitoringServerAgent | QMSAgent - 001 - Number of metrics reports received per second | |
| LS:QMSAgent - 00 - QoEMonitoringServerAgent | QMSAgent - 003 - Number of metrics reports accepted per second | |
| LS:QMSAgent - 00 - QoEMonitoringServerAgent | QMSAgent - 005 - Number of metrics reports rejected per second | |
| LS:QMSAgent - 00 - QoEMonitoringServerAgent | QMSAgent - 012 - Number of message queue messages sent per second | |
| LS:QMSAgent - 00 - QoEMonitoringServerAgent | QMSAgent - 013 - Number of message queue messages that could not be sent | |
| LS:SIP - 00 - Networking | SIP - 006 - Connections Refused Due To Server Overload | |
| LS:SIP - 01 - Peers | SIP - 000 - Connections Active | |
| LS:SIP - 01 - Peers | SIP - 020 - Average Outgoing Queue Delay | |
| LS:SIP - 02 - Protocol | SIP - 012 - Messages In Server | |
| LS:SIP - 02 - Protocol | SIP - 021 - Average Incoming Message Processing Time | |
| LS:SIP - 04 - Responses | SIP - 052 - Local 500 Responses | |
| LS:SIP - 04 - Responses | SIP - 055 - Local 503 Responses/sec | |
| LS:SIP - 06 - Authentication | SIP - 002 - Security Association (SAs) Stored | |
| LS:SIP - 06 - Authentication | SIP - 017 - Incoming Messages Not Authenticated/sec | |
| LS:SIP - 06 - Authentication | SIP - 019 - Incoming Messages Not Authorized/sec | |
| LS:SIP - 06 - Authentication | SIP - 031 - Authentication System Errors/sec | |
| LS:SIP - 07 - Load Management | SIP - 000 - Average Holding Time For Incoming Messages | |
| LS:SIP - 07 - Load Management | SIP - 006 - Incoming Messages Timed out | |
| LS:SIP - 07 - Load Management | SIP - 009 - Address space usage | |
| LS:USrv - 00 - REGDBStore | USrv - 000 - Queue Depth | |
| LS:USrv - 00 - REGDBStore | USrv - 002 - Queue Latency (msec) | |
| LS:USrv - 13 - Endpoint Cache | USrv - 001 - Active Registered Endpoints | |
| LSResponse Group | LS:RGS - 00 - Response Group Service Hosting | RGS - 000 - Total number of incoming calls that were declined because of a Match Making failure |
| LS:RGS - 01 - Response Group Service Call Control | RGS - 004 - Total number of incoming calls declined because of memory pressure | |
| LS:RGS - 01 - Response Group Service Call Control | RGS - 006 - Total number of incoming calls declined because of high number of active calls | |
| LS:RGS - 02 - Response Group Service Match Making | RGS - 001 - Current number of calls | |
| LS:RGS - 03 - Response Group Service Workflow | RGS - 011 - Calls that failed due to critical server errors | |
| LSWeb Conferencing Edge | LS:DATAPROXY - 00 - Server Connections | DATAPROXY - 001 - Server Connections Currently Active |
The following alert thresholds are set by default:
| Lync Component | Performance Object Name | Counter Name | Alert Condition |
| LSInstant Message Conferencing | LS:ImMcu - 00 - IMMcu Conferences | IMMCU - 020 - Throttled Sip Connections | WARN if ›= 2 |
| LS:ImMcu - 02 - MCU Health And Performance | IMMCU - 005 - MCU Health State | WARN if = 1 ALARM if = 2 or 3 |
|
| LSRegistrar | LS:SIP - 01 - Peers | SIP - 000 - Connections Active | WARN if ›= 10000 ALARM if ›= 15000 |
| LS:SIP - 07 - Load Management | SIP - 000 - Average Holding Time For Incoming Messages | WARN if ›= 3000 ms ALARM if ›= 6000 ms |
|
| LSPresence Focus | LS:USrv - 01 - DBStore | USrv - 002 - Queue Latency (msec) | WARN if ›= 100 ms ALARM if ›= 6000 ms |
| LS:USrv - 01 - DBStore | USrv - 004 - Sproc Latency (msec) | WARN if ›= 100 ms ALARM if ›= 6000 ms |
These are the only performance alerts that are generally recommended by Microsoft Lync experts. The other counters are available for further diagnosis when problems occur.
Installation
Prerequisites
In order to setup the monitoring of Microsoft Lync Server 2010, you will need to make sure the following items are available, installed and properly configured:
- A fully functional BMC PATROL environment (optionally part of a larger BPPM environment), with a BMC PATROL Console
- A PATROL Agent on the Lync Server itself
- Monitoring Studio KM for PATROL, installed on the agent on the Lync Server itself, minimum version 8.6.53, with patch P1270
- Monitoring Studio KM is properly loaded on the agent and in the console
- The Lync2012-01-31.cfg installed in a folder on the Lync Server itself
Procedure
- From the PATROL Console, [right-click] on the main “Monitoring Studio” icon › [KM Commands] › [Configuration] › [Import Configuration…]
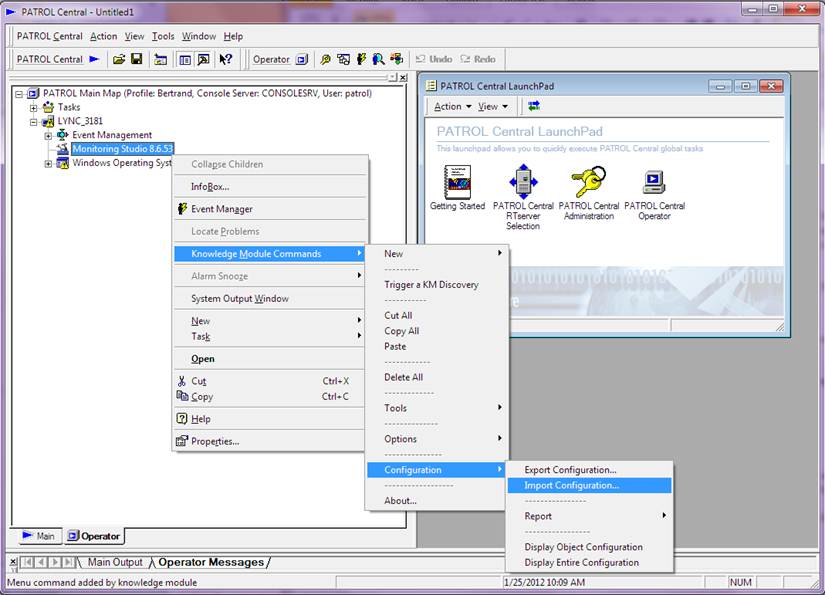
- Enter the path of the folder where you have stored the Lync2012-01-31.cfg file (this path is on the agent, on the Lync Server):
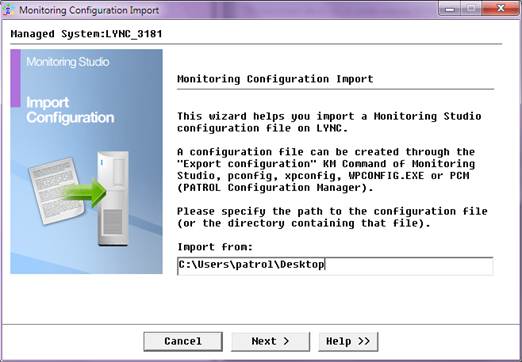
- Select the Lync2012-01-31.cfg file in the list:
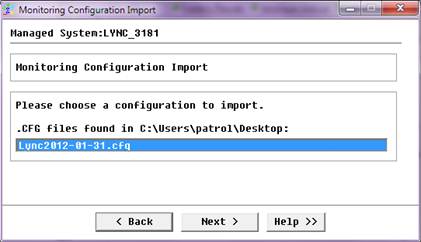
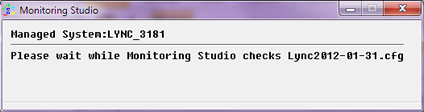
- Monitoring Studio checks the content of the file. This process can take a few minutes (the configuration file is rather large).
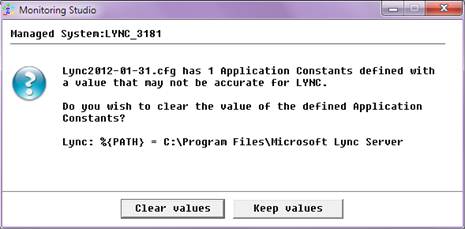
- Monitoring Studio then asks whether the %{PATH} application constant should be cleared. If the default value (“c:\Program Files\Microsoft Lync Server”) happens to match with the installation directory of Microsoft Lync on the server, then you can click on the [Keep values] button. Otherwise, click on the [Clear values].
- Monitoring Studio is ready to import the configuration. Click [Finish] to start the import.
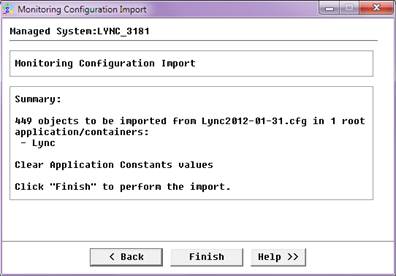
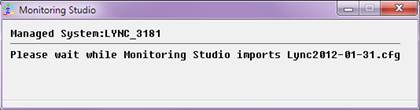
- The import process can take a few minutes:
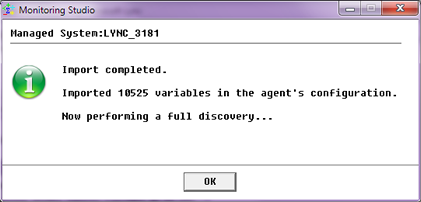
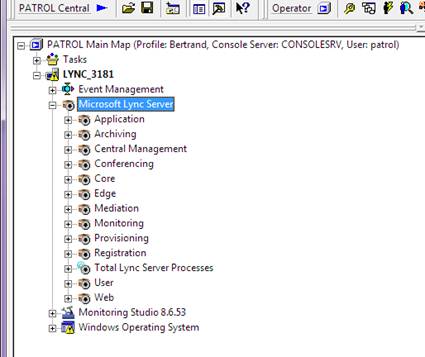
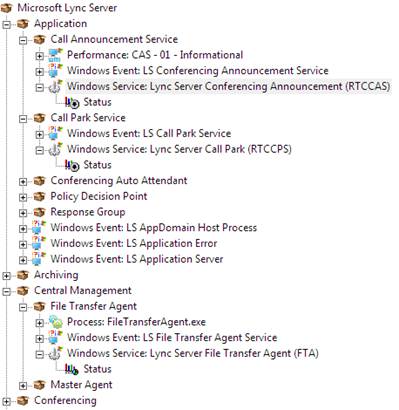
- After the import process completes, Monitoring Studio KM starts creating the icons corresponding to the monitored objects in the PATROL Console. If you chose to clear the %{PATH} application constant, all icons are kept OFFLINE and the actual monitoring does not start until you enter a valid value for the application constant:
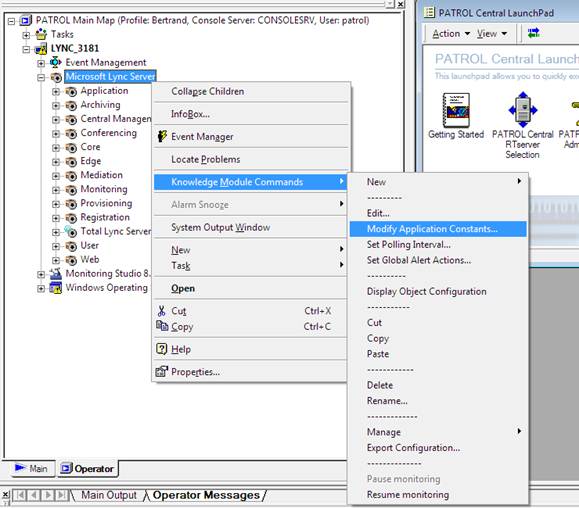
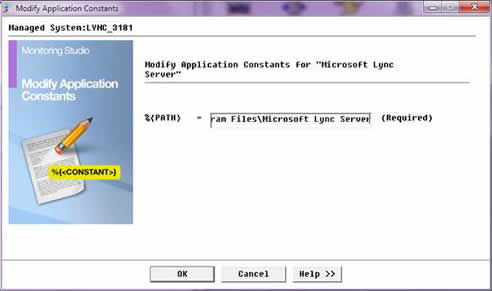
- To set the %{PATH} application constant value, [right-click] on the “Microsoft Lync Server” icon in the PATROL Console › [KM Commands] › [Modify Application Constants…]
- Next to the %{PATH} constant, enter the path of the folder where Microsoft Lync has been installed on the system and click [OK]. It usually is c:\Program Files\Microsoft Lync Server:
Monitoring Studio brings all the monitored objects ONLINE and the monitoring of Microsoft Lync Server starts effectively. The initialization of the monitoring can take a couple minutes to complete.
Alternate Installation Procedure
Alternatively, PATROL administrators can use WPCONFIG.EXE, pconfig or PCM (PATROL Configuration Manager) to deploy the Lync2012-01-31.cfg configuration file. Once this is done, it is recommended to force a full discovery on the PATROL Agent to make sure Monitoring Studio KM takes into account the new configuration immediately (without waiting for the next discovery cycle, which occurs by default every hour).
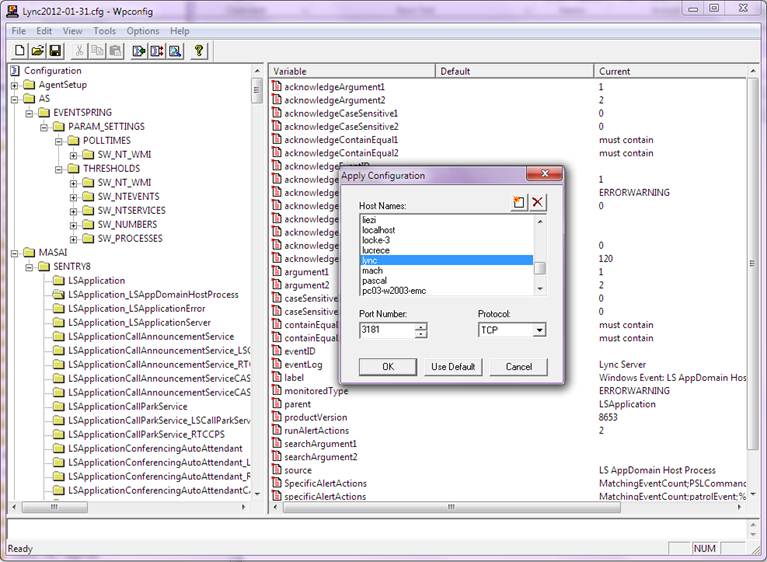
Editing the %{PATH} application constant as described above is still required to make sure the monitoring is adapted to the environment. This can also be done by editing the /MASAI/SENTRY8/Lync/constant1Value configuration variable before applying the configuration to the selected Lync servers.
Post-installation tasks
As explained earlier, depending on the role of a Microsoft Lync Server, different components of Lync Server have been installed and configured. The monitoring configured in Monitoring Studio covers all components of Lync and you may need to disable or completely remove certain groups of monitored objects from the monitoring.
The different aspects of Microsoft Lync are grouped in containers/folders in Monitoring Studio. In order to identify the components that would need to be removed from the monitoring, you simply have to first “browse” the tree view to find “Windows Service” objects for which the Status parameter cannot be collected (it stays OFFLINE, while the rest of the monitoring is properly collected). Also, an error message is displayed in the System Output Window for each service that is not installed and thus whose monitoring cannot be performed:
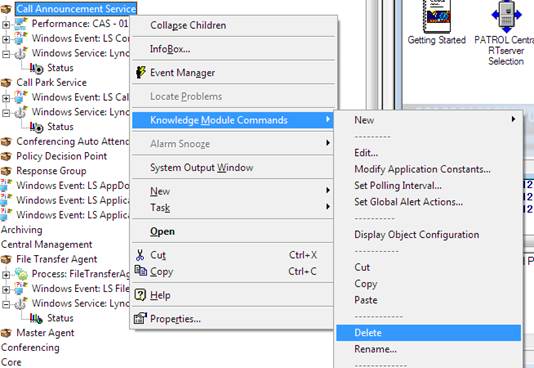
For each “container” with a Windows service that is not installed and cannot be collected, you can remove it from the monitoring. [Right-click] on the container icon › [KM Commands] › [Delete]:
Once this is done, you should no longer see any error message in the System Output Window and the monitoring is adapted to your environment.
Related Topics
- Monitoring Microsoft Lync Server 2013/Skype for Business with Monitoring Studio 8 or 9
- Monitoring Dell EMC Avamar Appliances using Monitoring Studio KM
- Monitoring PostgreSQL with Monitoring Studio using the Database Query Analysis Tool
- Monitoring Studio X - Monitoring Remote Log/Flat Files
- Monitoring SharePoint 2016 and 2019 with Monitoring Studio X